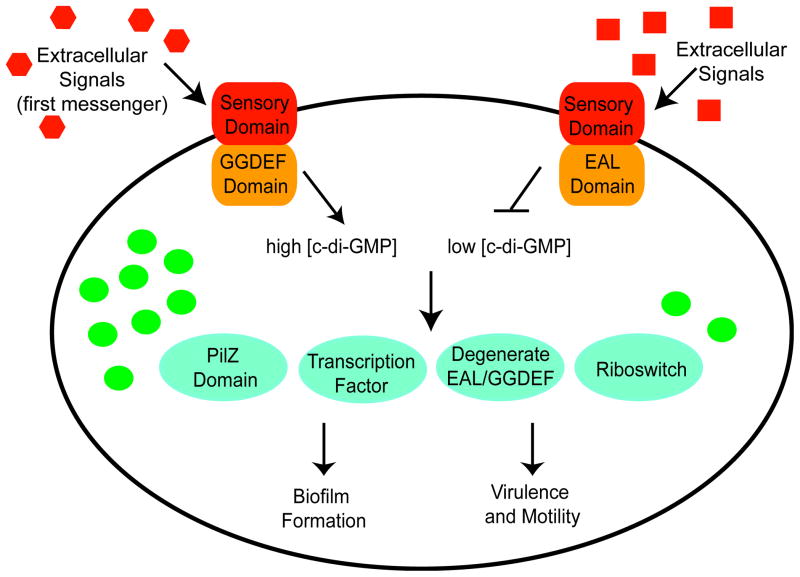
Figure 2.
Schematic of c-di-GMP signaling in bacteria. c-di-GMP metabolizing enzymes are shown as orange rectangles, c-di-GMP molecules are represented by green circles, and receptors of the second messenger are indicated in teal circles. Similar to the EAL domain, some bacteria also utilize HD-GYP domain proteins to decrease intracellular levels of c-di-GMP. Phenotypic outputs induced by high concentrations of the second messenger are indicated on the bottom left and those induced by low concentrations are indicated on the bottom right.

