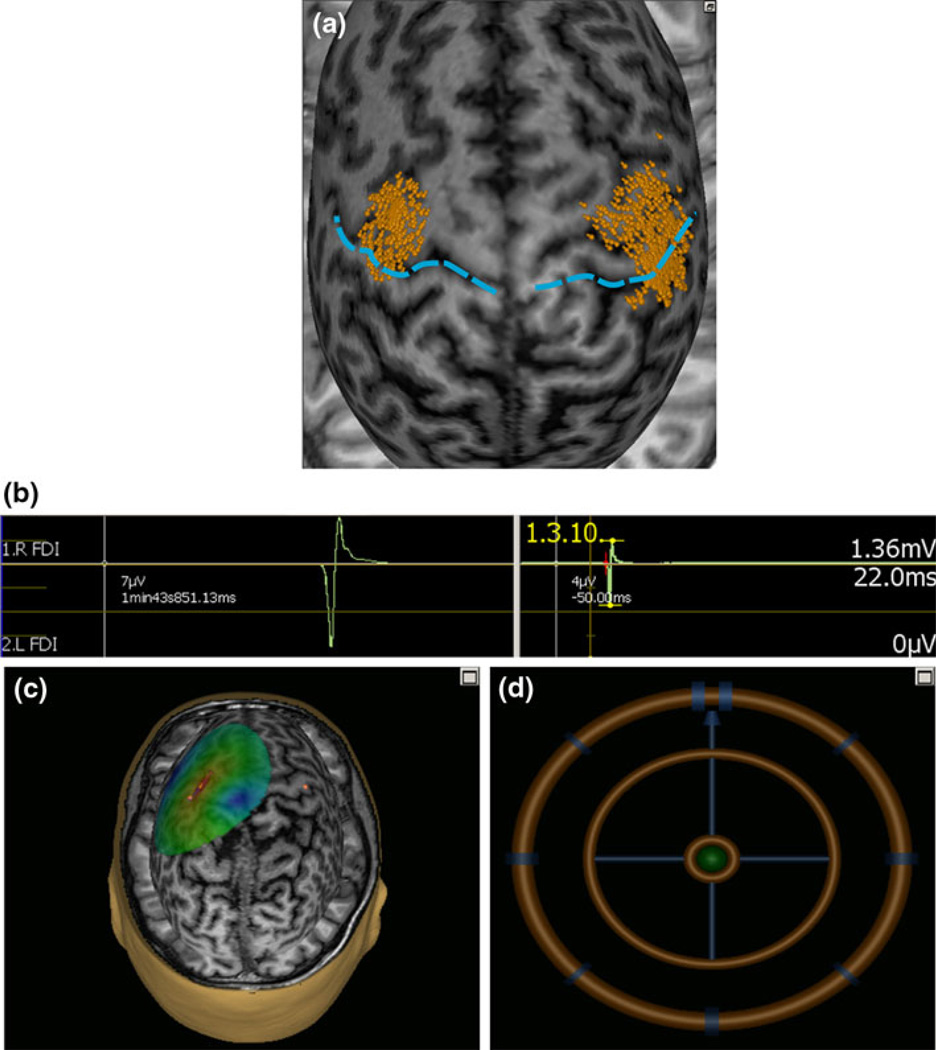
Fig. 1.
An sample screenshot in one subject illustrating (a) the area mapped to identify the motor optimal location (hot-spot) for first dorsal interosseus (FDI) muscle relative to the central sulcus (blue dashed line). The each dot on the scalp are visualized as small ball and the head of ball showed the orientation of a single pulse. b A single evoked response in FDI measured as peak to peak amplitude and onset latency. c The colors show the relative strength of the E-field (red high and blue low E-field strength). The color-code intensity map representing interpolated motor evoked potential amplitude. d The position feedback indicator, providing real time feedback surface location, roll, pitch and yaw for consistent and reliable targeting. The brain is “peeled” into 25 mm depth, i.e., the visualized stimulation surface resides at this depth from the scalp

