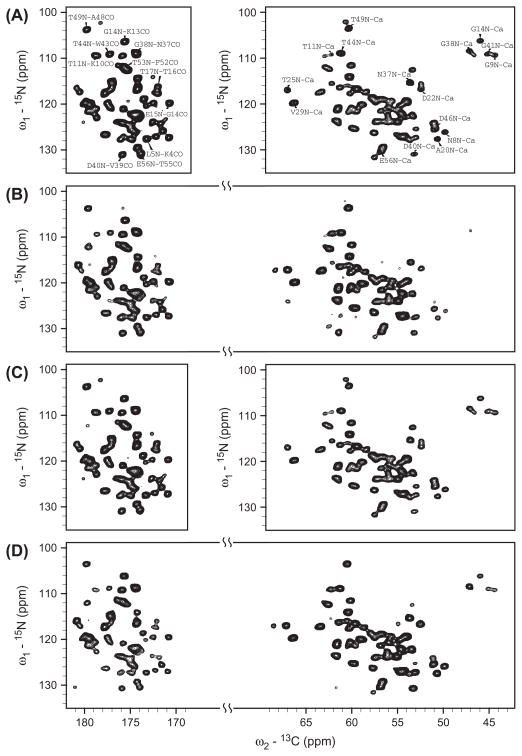
Fig. 3.
2D 15N–13C heteronuclear correlation spectra of uniformly 13C,15N-labeled GB1 protein using different N → C polarization conditions. (A) Single-band SPECIFIC 15N–13Cα (Right) and 15N–13C′ (Left) spectra recorded in two separate experiments with the same experimental parameters as in Fig. 2B and C, respectively. (B) Dual-band rectangular DCP 15N–13Cα/13C′ spectrum using the same parameters as in Fig. 2D. (C) Single-band selective 15N–13Cα (Right) and 15N–13C′ (Left) smDCP spectra recorded in two separate experiments with the same experimental conditions as in Fig. 2E and F, respectively. (D) Dual-band selective 15N–13Cα/13C′ smDCP spectrum using the same parameters as in Fig. 2G. The spectra were processed by nmrPipe [54] and plotted with Sparky [55]. In all experiments, 40 transients were used to accumulate the signals for each t1 increment with a recycle delay of 3.5 s.

