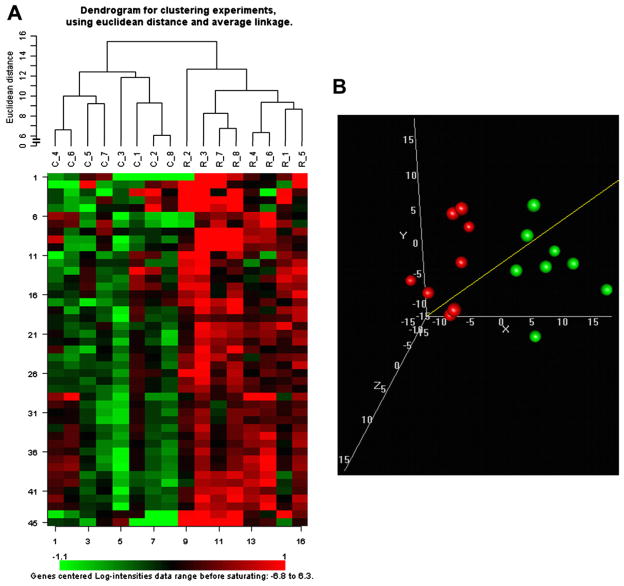
Fig. 1.
Significant changes in miRNA signatures after irradiation. (A) Hierarchic clustering. A heat map shows miRNA expression levels for all samples (columns) and miRNAs (rows). All patient control samples (labels starting with C) form a separate cluster from the samples obtained after radiation therapy (labels starting with R). (B) Multidimensional scaling. Control samples (shown in green) and samples that were collected after total body irradiation (displayed in red) form two separate clusters.

