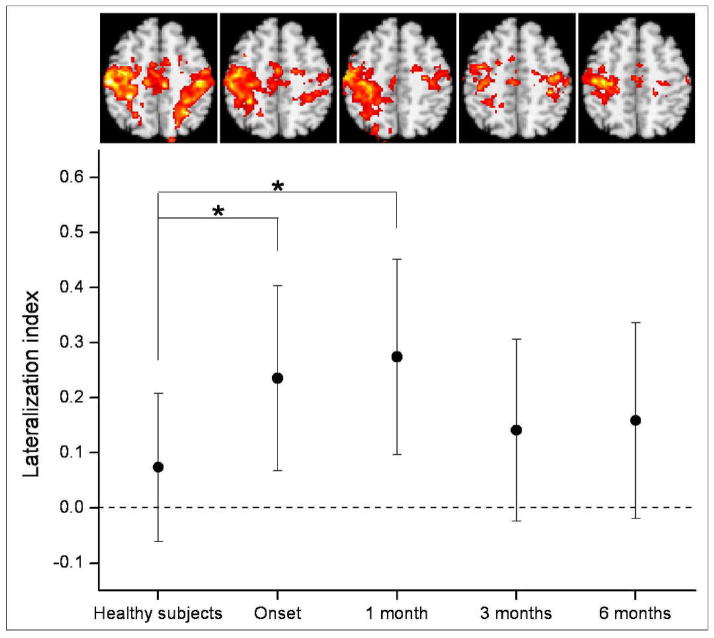
Figure 3.
Time-dependent changes in resting-state functional connectivity. Quantitative changes were exhibited by the lateralization index (LI) and corresponding maps of functional connectivity were also displayed. The LI was compared between patients and healthy subjects over four time points, including onset, 1 month, 3 months, and 6 months after onset. In the graph of the LI, points represent means, error bars represent standard deviations, and stars represent significant differences between patients and healthy subjects at a threshold of P < 0.05.

