Figure 3.
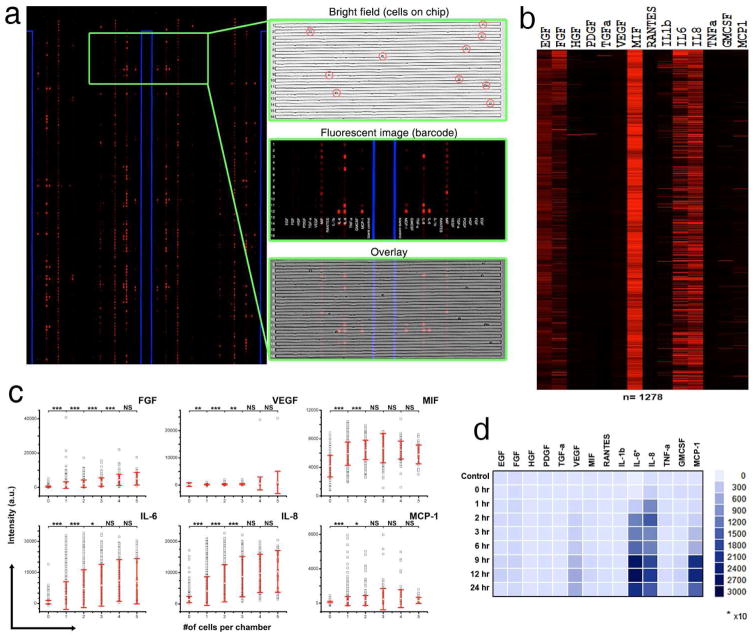
Single-cell secretomic analysis on U87 cell lines. (a) Representative region of the scanned image showing the raw data of single cell secretomic measurement. Three subpanels on the right are optical micrograph, fluorescence image and overlay for 16 microchambers. (b) Heat map that shows the profile of 14 proteins secreted from 1278 single cells (U87). Each row is a single cell and each column corresponds to a protein of interest. (c) Scatter plots showing fluorescence intensity measured for six selected proteins (FGF, VEGF, MIF, IL-6, IL-8, MCP-1) versus the number of cells in a microchamber. (* P < 0.05, ** P < 0.01, *** P < 0.001) (d) Population kinetics for U87 cell line. Control (MEM medium), secretion supernatant from population at different time points (0 hr, 1 hr, 2 hr, 3 hr, 6 hr, 9 hr, 12 hr, 24 hr).

