Figure 2. DCNs are equivalent, their lineage is intrinsically variable and does not predict the wiring pattern.
(A, A′) The cell fate marker atonal is expressed at L3 stage in all DCNs. (B, B′) Acj6, a cell fate marker is expressed in all DCNs at L3 stage. (A, B) Scale bar: 50 µm. (A′, B′) Scale bar: 5 µm. (C) Quantification of the number of DCN soma (38.13 ± 2 SD, n = 15) and medulla axons (12.13 ± 1.36 SD) (Data shown as mean ± SEM). (D) There is no correlation detectable between the number of neurons of the left and right clusters in individual brains (r = −0.112, n = 14). (E) 3D reconstruction of a single dorsal cluster. Red cells symbolize neurons innervating the medulla. These neurons are distributed along the D-V axis. (F) An example of a single GFP-positive DCN soma located distally within the dorsal cluster which is marked in red (LacZ). (G) Quantification of the position of a DCN soma (proximal, distal) within the dorsal cluster and its axon target choice of medulla or lobula neuropil (n = 16). There is no preference for axon target choice based on the cell body position within the cluster. (H) An example of the flip out technique used to analyze the relation between neuron position and axon position along the D-V axis. DCN: dorsal cluster neurons; D-V: dorsal–ventral.

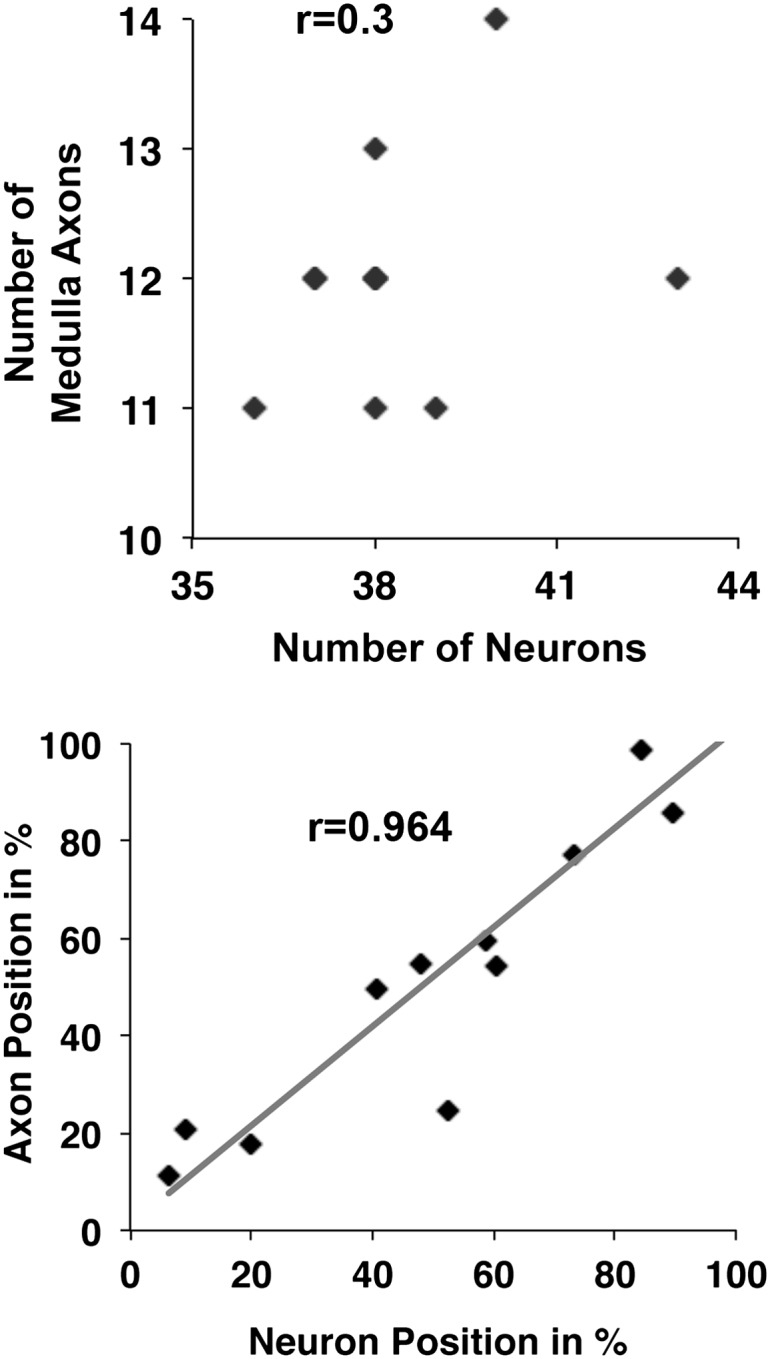
Figure 2—figure supplement 1. DCN cell body position highly correlates with its D-V axon position.