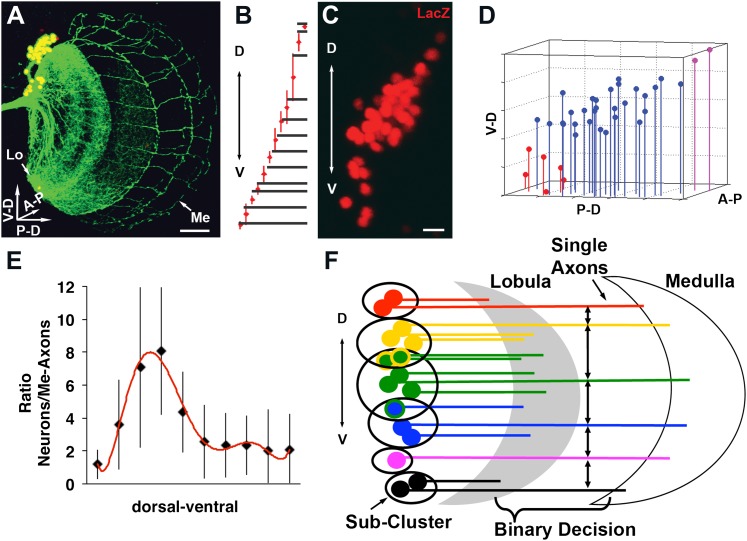
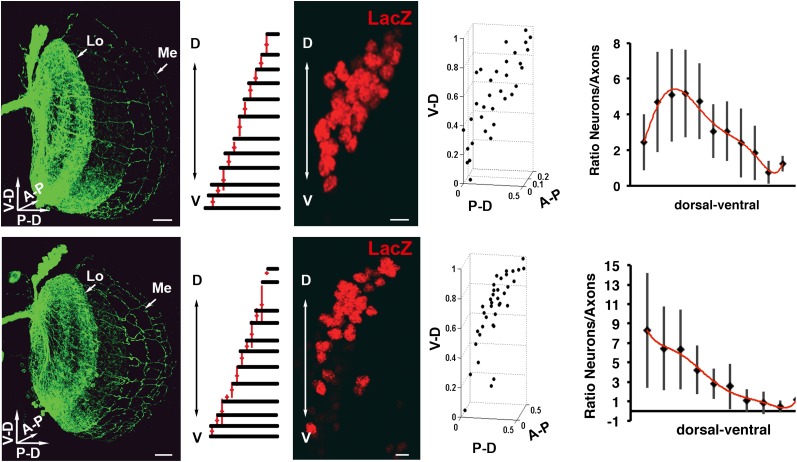
Figure 3. Quantitative analysis of the DCN soma and axon.
(A) A typical DCN axonal pattern showing GFP-labeled neurites (green) and LacZ labeled soma (red). Scale bar: 20 µm. (B) Analysis of interaxonal distances of DCN medulla axons along the D-V and A-P axes. Medulla axons are less dense medially and more dense dorsally and ventrally (n = 16). (C) Projection of a typical DCN cluster with sparse soma dorsally and ventrally and a high soma density medially. Scale bar: 5 µm. (D) 3D stem plot of the DCN cluster shown in (C) displays lines extending form P-D and A-P axis while the 3D position is marked with a filled circle—red indicates ventral cells, blue shows medial, and magenta shows dorsal cells. Vertical lines along the P-D and A-P axes form a representation of the density of the DCNs. (E) Ratio of the number of DCNs and their medulla axons along the D-V axis (n = 16). While dorsally and ventrally 1–2 neurons generate one medulla axon, medially 4–8 neurons produce one medulla axon. (F) Schematic representation of the sub-cluster model: a DCN cluster is divided into several overlapping subsets of neighboring neurons. Each subset provides one medulla axon which leads to pattern of spaced single axons in the medulla. A-P: anterior–posterior; DCN: dorsal cluster neurons; D-V: dorsal–ventral; P-D: proximal–distal.


