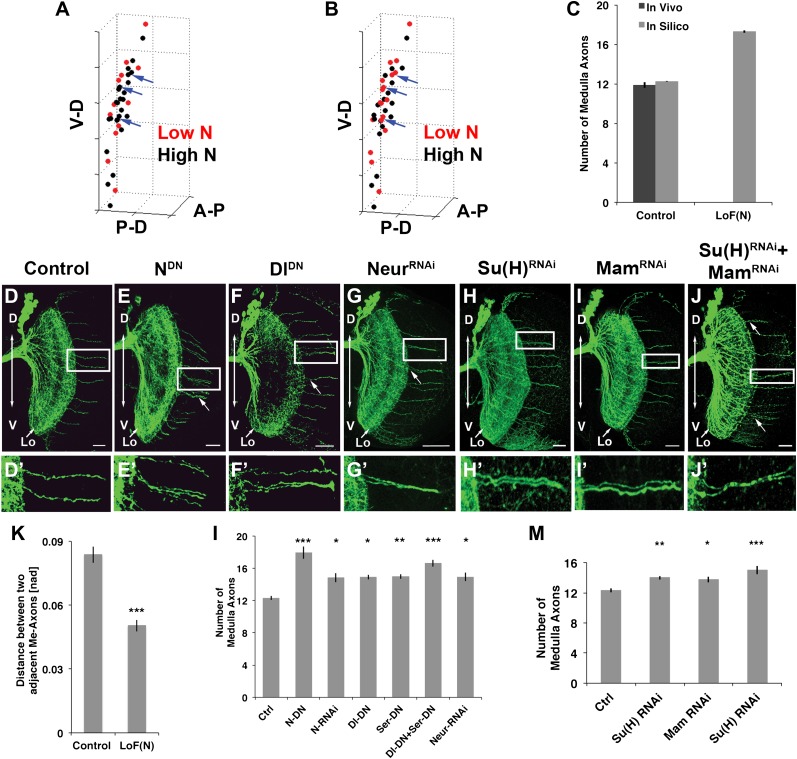
Figure 5. Canoncial Notch pathway genes are required postmitotically for axon targeting.
(A, B) A representation of an in vivo DCN cluster with in silico control (A) and in silico reduced Notch activity conditions (B). Red symbolizes cells with low Notch expression level. These cells will project their axon to the medulla. Black represents cells with high Notch expression level. Black cells will target their axon to the lobula. While in (A) red cells are singular (blue arrows) in (B) red cells located medially appear to be clustered (blue arrows). V-D: ventral–dorsal axis; P-D, proximal–distal axis; A-P, anterior–posterior axis. (C) The in silico predicted number of medulla axons under control resemble the in vivo data. In vivo control 11.88 ± 1.2 SD (n = 16), in silico control 12.26 ± 2.3 SD (p>0.05) (n = 1600). In silico loss of Notch function prediction results in an increase of medulla axons: 17.29 ± 3.96 SD (n = 1600). Data shown: mean ± SEM. (D) Control pattern of spatially separated single medulla axons. (E-G, E′-G′). Reduction of Notch or Delta activity or RNAi knockdown of Neur result in clustered axons. (H-J, H′-J′) RNAi knock-down of Su(H), Mam, or both results in clustered axons. Scale bar: 20 µm. (K) Quantification of the clustered axons observed under loss of Notch condition in comparison to control. Clustered axons were described by distance measurements between two adjacent medulla axons. Distances between two adjacent medulla axons under loss of Notch condition are significantly smaller. Control: 0.084 [nad] (=normalized arbritrary distance) ± 0.044 SD (n = 136), NotchDN 0.050 [nad] ± 0.034 SD (n = 174) (p<0.0001, Mann–Whitney Test, both distribution are non-Gaussian). (L) Inhibition of Notch, the ligands Delta and serrate, and Neuralized increases the number of medulla axons. Control 12.33 ± 0.89 SD (n = 12, Gaussian distribution), NotchDN 17.95 ± 2.67 SD (n = 20, Gaussian distribution) (p<0.001), Notch RNAi 14.83 ± 1.9 SD (n = 12, Gaussian distribution) (p<0.05), DeltaDN 14.92 ± 1 SD (n = 12, Gaussian distribution) (p<0.05), SerrateDN 15.0 ± 1.62 SD (n = 16, Gaussian distribution) (p<0.01), DeltaDN + SerrateDN 16.64 ± 1.92 SD (n = 14, Gaussian distribution) (p<0.001), Neur RNAi 14.93 ± 1.11 SD (n = 15, non-Gaussian distribution) (p<0.05); (non-parameteric Kruskal–Wallis Test, Data shown: mean ± SEM). (M) Inhibition of Su(H), Mam, or both significantly increases the number of medulla axons. Control 12.33 ± 0.89 SD (n = 12, Gaussian distribution), Su(H) RNAi 14.00 ± 0.82 SD (n = 10, Gaussian distribution) (p<0.01), Mam RNAi 13.75 ± 1.22 SD (n = 12, non-Gaussian distribution) (p<0.05), Su(H) RNAi + Mam RNAi 15.0 ± 1.66 SD (n = 9, non-Gaussian distribution) (p<0.001). Non-parameteric Kruskal–Wallis Test, Data shown: mean ± SEM. DCN: dorsal cluster neurons; SD: standard deviation.
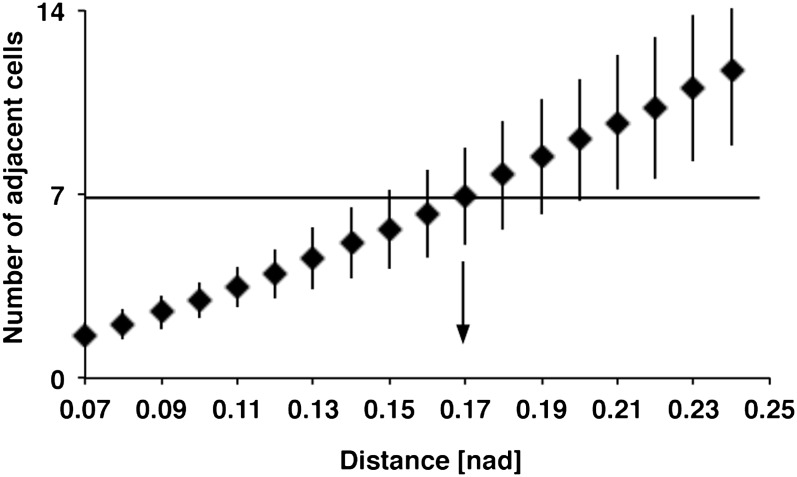
Figure 5—figure supplement 1. Relation between DCN soma distance and the number of adjacent cells within a subcluster.
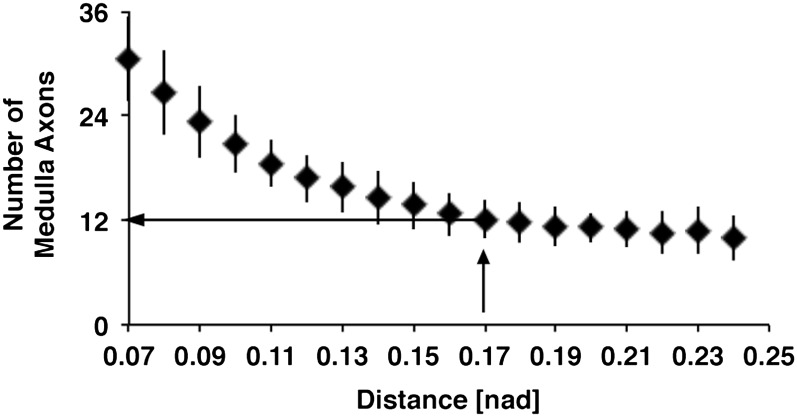
Figure 5—figure supplement 2. Relation between distances of DCN soma and number of medulla axons.
Figure 5—figure supplement 3. Loss of Delta increase the number of medulla axons.
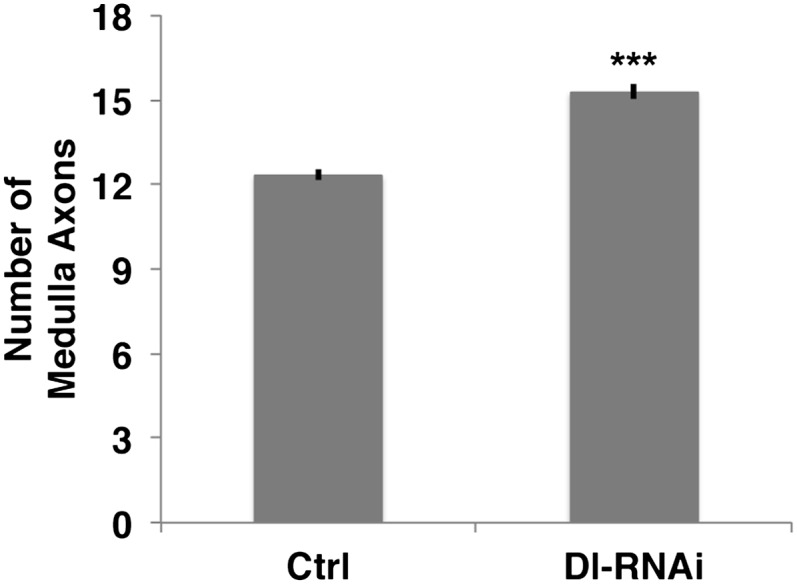
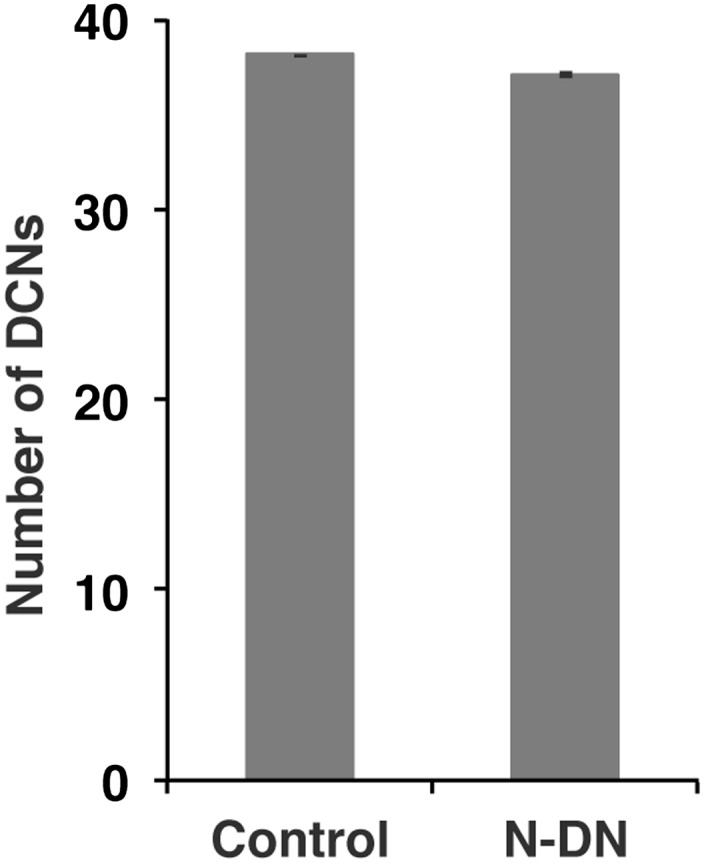
Figure 5—figure supplement 4. No function of Notch in DCN cell number.
