Figure 7.
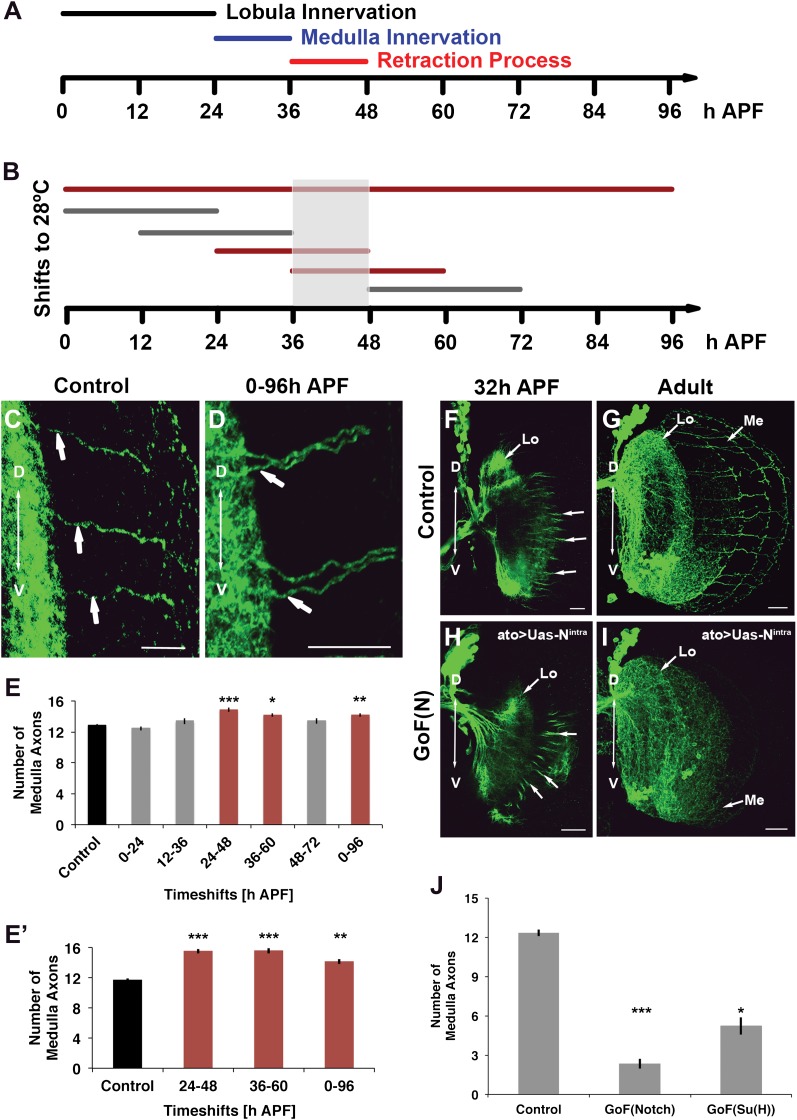
Notch acts specifically during the axon sorting phase to regulate DCN axon targeting. (A) Schematic of the axonal dynamics of DCNs during pupal development. (B) Schematic of the temperature shift experiments (to 28°C) to determine the temporal requirement for Notch during pupal development. (C–D) Reduction of Notch activity (using Notchts) during all of pupation leads to clustered axons in comparison to control. Scale bar: 20 µm. (E) Reduced Notch activity (Nts) alters the medulla innervation pattern at 24–60 hr APF, but neither before nor after. Control 12.86 ± 0.66 SD (n = 14, non-Gaussian distribution), 0–96 hr APF 14.18 ± 0.92 SD (n = 18, non-Gaussian distribution) (p<0.01), 0–24 hr APF 12.46 ± 0.97 SD (n = 13, Gaussian distribution), 12–36 hr APF 13.38 ± 1.39 SD (n = 14, non-Gaussian distribution), 24–48 hr APF 14.86 ± 1.03 SD (n = 14, non-Gaussian distribution) (p<0.001), 36–60 hr APF 14.15 ± 0.69 SD (n = 13, not Gaussian distributed) (p<0.01), 48–72 hr APF 13.4 ± 1.07 SD (n = 10, non-Gaussian distribution). Non-parametric Kruskal–Wallis Test. (E′) Confirmation of the requirement of Notch signaling during pupation using tubGal80ts: Control 11.71 ± 0.92 SD (n = 17, non-Gaussian distribution), 24–48 hr APF 15.55 ± 1.04 SD (n = 17, non-Gaussian distribution) (p<0.001), 36–60 hr APF 15.60 ± 1.17 SD (n = 18, Gaussian distribution) (p<0.001), 0–96 hr APF 14.15 ± 1.11 SD (n = 13, non-Gaussian distribution) (p<0.01). (F–I) comparison of axonal pattern formation at two different time points under control and gain of Notch activity. Scale bar: 20 µm. At 32 hr APF the axonal extension process is still active. Under both conditions (control (F) and gain of Notch function (H)) axons extend toward the medulla. (G, I) Axonal pattern of the DCNs at adult stage. While the control brain shows the normal pattern of medulla axons (G), under gain of Notch function there is only one medulla axon visible (I). (J) Quantification of the number of medulla axons using gain of Notch function and gain of Su(H) function. Activation of the canonical Notch pathway decreases the number of medulla axons significantly in comparison to the control. Control 12.33 ± 0.89 SD (n = 12, Gaussian distribution), gain of Notch function 2.33 ± 1.24 SD (n = 15, non-Gaussian distribution) (p<0.001), gain of Su(H) function 5.22 ± 1.99 SD (n = 9, Gaussian distribution) (p<0.05) (E, E′, J: non-parametric Kruskal Wallis Test, Data shown: mean ± SEM). APF: after puparium formation; DCN: dorsal cluster neurons; NICD: intracellular domain of Notch; SD: standard deviation; SEM: standard error of the mean.

