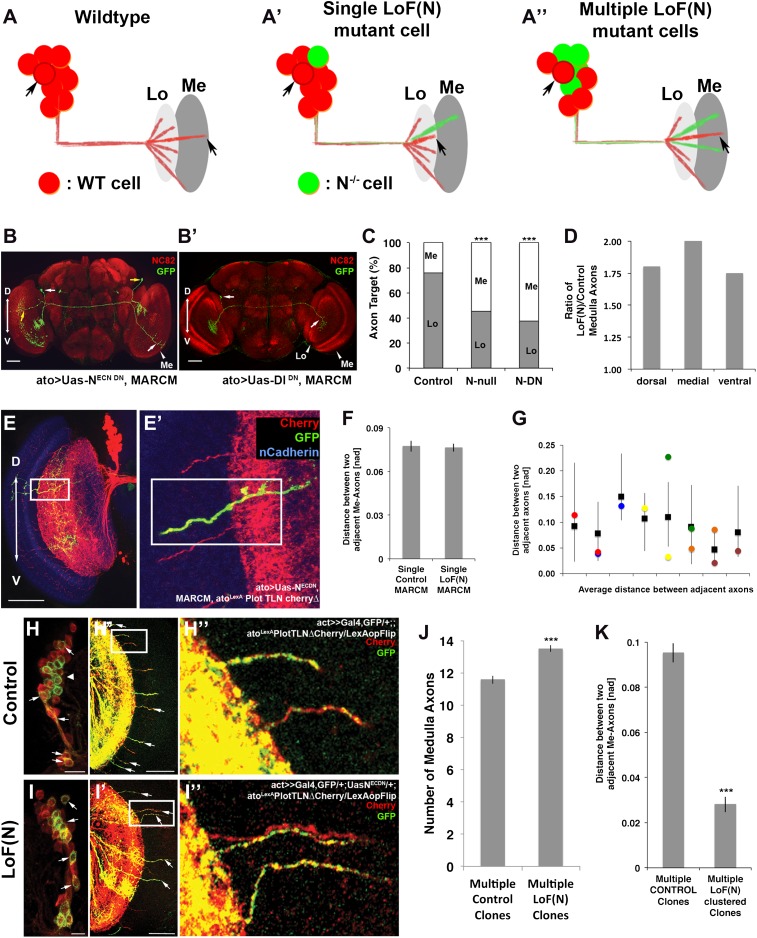
Figure 8. Notch cell autonomously regulates axon targeting.
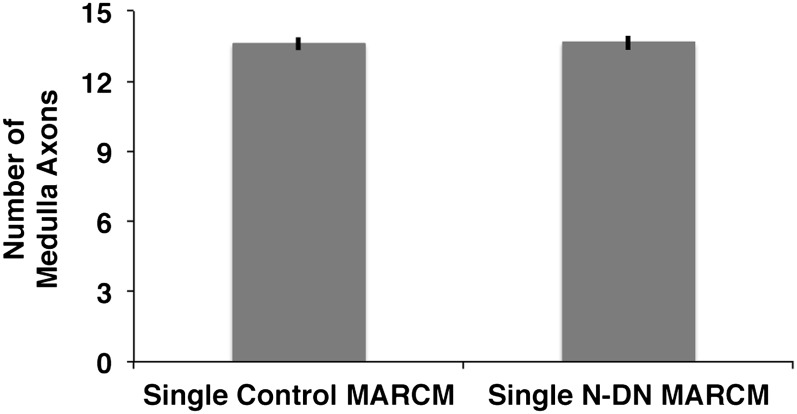
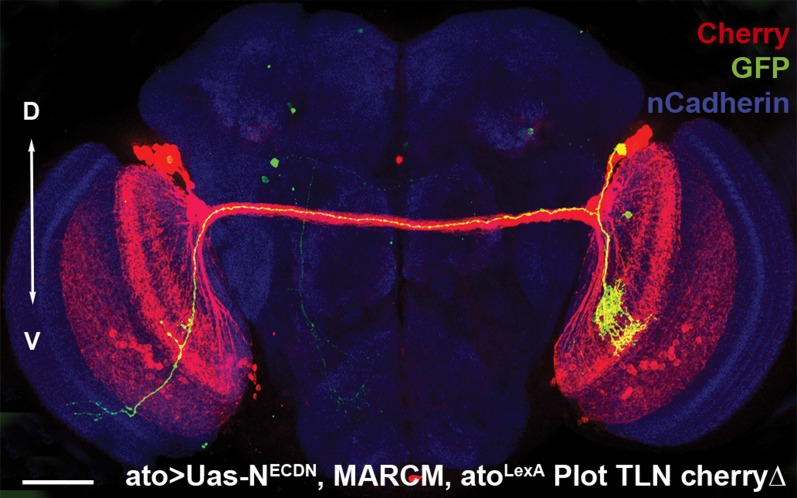
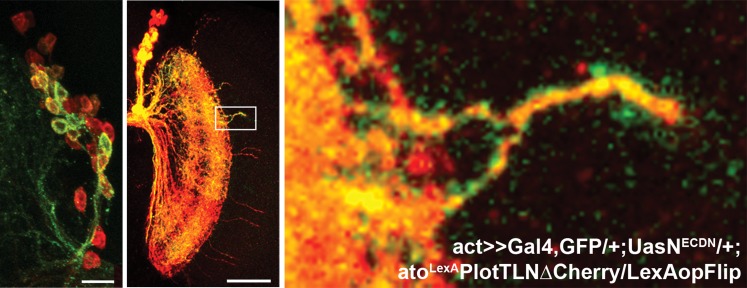
(A–A″) Schematic of a mutual inhibition hypothesis of DCN axon sorting under control and Notch loss of function conditions. (A) Under control conditions only single axons innervate the medulla neuropil from each interacting subcluster. The red cell represents one of the wild-type neurons. (A′) A single Notch mutant cell (green cell) will project its axon towards the medulla neuropil and consequently adjacent cells will retract back towards the lobula to ensure single medulla innervations. (A″) In contrast to the single Notch mutant cell situation, multiple Notch mutant cells will not compensate and generate multiple clustered medulla axons. (B) Adult Drosophila fly brain in which the neuropil is marked with mAb nc82 (red). Single GFP-positive Notch mutant DCNs is generated using the MARCM technique. White and yellow arrows mark DCN soma and their respective medulla axons. Scale bar: 50 µm. (B′) Single GFP-positive Delta mutant DCN is generated using the MARCM technique. White arrows mark DCN soma and their respective lobula axon. Scale bar: 50 µm. (C) Analysis of the MARCM experiment represented in (B). Approximately 24% of all control single cell clones project toward the medulla (n = 33). In contrast, Notch mutant single cell clones using either a null allele (N55e11) or NotchDN innervate the medulla 55% or 63% of the time (n = 22 and 24), respectively (Control vs N55e11, p<0.001; Control vs NotchDN, p<0.001; Fisher's exact test). (D) The probability of a single DCN with no Notch activity to target the medulla is twice as high medially in comparison to the control, 1.8 times higher dorsally and 1.75 times higher ventrally (n = 22). (E–E′) DCN cluster labeled with the general membrane marker TLNΔCherry (Nicolai et al., 2010) (red) driven by the LexA operon (LexAop) and a LexA knock-in into the atonal locus using the IMAGO (Choi et al., 2009) technique. A single GFP-positive (green) cell clone expressing NotchDN was generated using MARCM technique in this background. The mutant GFP-positive medulla axon does not show clustering with neighboring control axons (red). Scale bar: 50 µm. (F) Comparison of distances between two adjacent medulla axons: Single control MARCM 0.077 ± 0.048 SD (n = 189, not Gaussian distributed), single loss of Notch function MARCM 0.076 ± 0.051 SD (n = 177, non-Gaussian distribution) (p>0.05, Mann–Whitney Test). (G) Individual distances between six loss of Notch function single MARCM clones and their two adjacent medulla axons in comparison to median control distances. The distances of 5/6 loss of Notch function medulla axons (colored squares) are within control range (black squares + range bars). Black squares represent the average distance between two adjacent medulla axons, whereas the bar represent minimum and maximum distance between two neighboring medulla axons under control condition. (H–H″, I–I″) Multiple in vivo DCN soma were mutated for Notch activity using a combination of IMAGO knock-in of LexA into the atonal locus and the flip-out technique to activate Gal4 stochastically during DCN axon outgrowth. An example of multicell DCN clones under control (H–H″) and loss of Notch function conditions (I–I″). While the control clone displays single medulla axons (H′, H″), clustered medulla axons are visible under loss of Notch function condition (I′, I″). The D-V axis correlation between a DCN soma and its axon is maintained under loss of Notch function conditions (white arrows). (J) A comparison between multiple control and multiple loss of Notch function clones demonstrates that DCN patterns with clustered axons show a significant increased number of medulla axons. Multicell control clones 11.6 ± 1.19 SD (n = 20, non-Gaussian distribution), multicell loss of Notch function clones 13.65 ± 1.09 SD (n = 20, non-Gaussian distribution) (p<0.001, Mann–Whitney Test). Data shown: mean ± SEM. (K) Comparison of distances between two adjacent axons considering only GFP-positive axons under multiple control and multiple loss of Notch function clones. Multiple control clones: 0.09 [nad] (=normalized arbritrary distance) ± 0.053 (n = 165, non-Gaussian distribution), multiple loss of Notch function clones: 0.028 ± [nad] 0.015 (n = 19, Gaussian distribution) (p<0.001, Mann–Whitney Test). DCN: dorsal cluster neurons; D-V: dorsal–ventral; SD: standard deviation; SEM: standard error of the mean.


