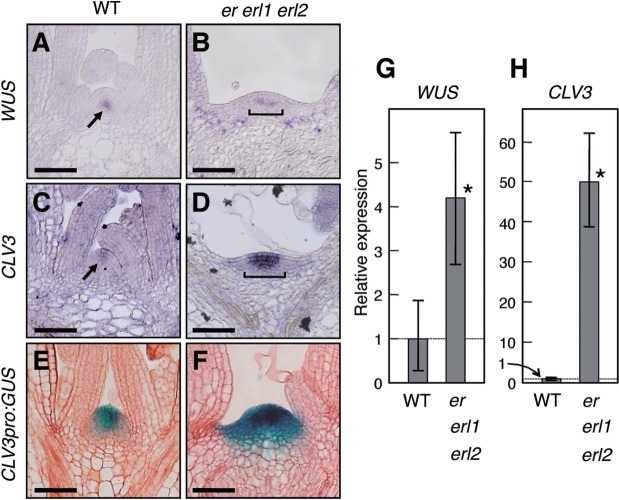
Fig. 3.
Expression patterns and levels of WUS and CLV3. Nine-day-old seedlings were analyzed. (A–D) In situ RNA hybridization. Arrows and brackets indicate signals. Bars = 50 µm. (E and F) CLV3pro:GUS. Bars = 50 µm. (G and H) Aerial parts were analyzed by qRT-PCR. The expression levels were normalized with respect to that of β-TUBULIN and the normalized values in the wild type were set at 1. Data shown are means of three independent samples (10 individuals were collected as a pool for each sample) with error bars representing the SD. Asterisks indicate significant differences by Student’s t-test (P < 0.05).

