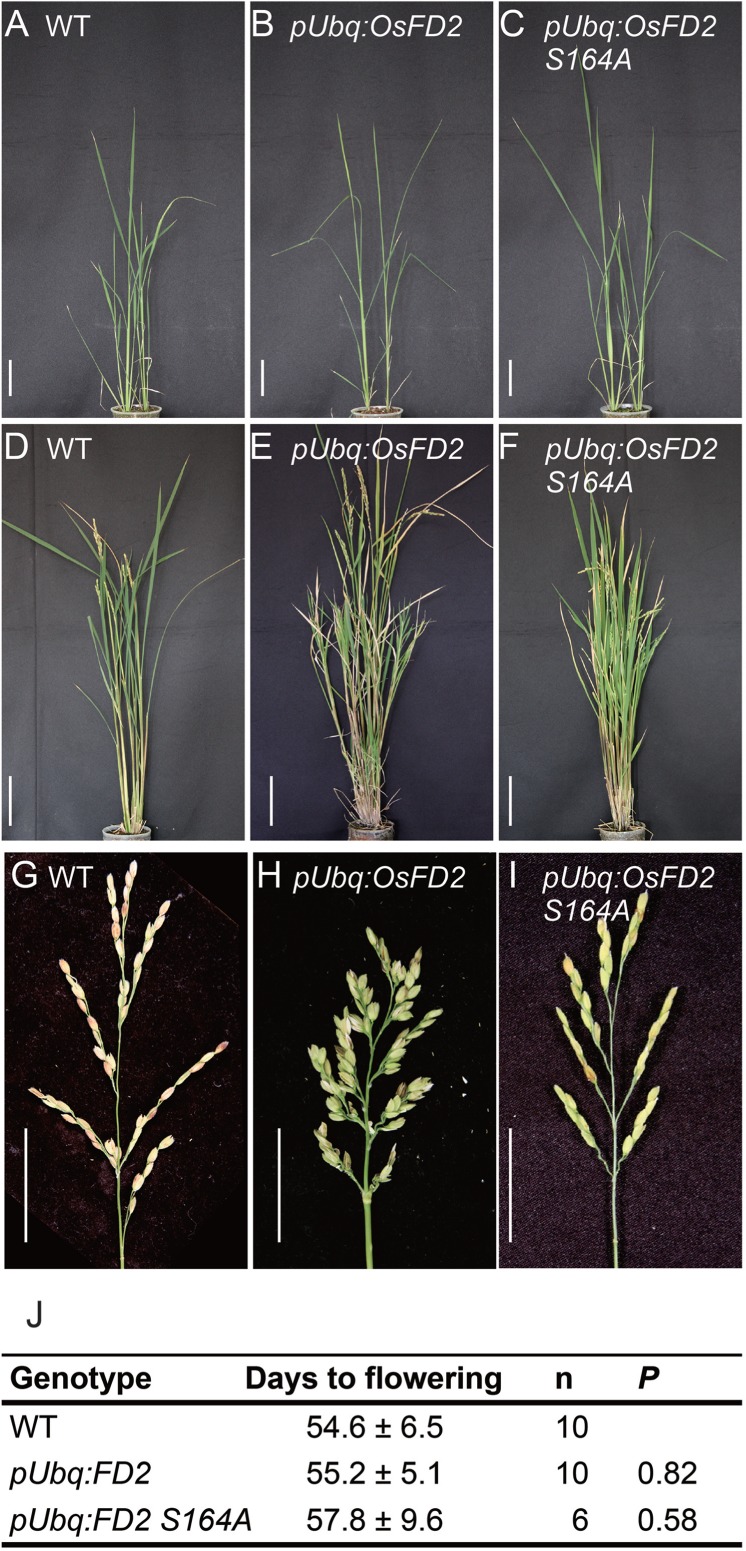
Fig. 3.

The effect of overexpressing OsFD2 on flowering and inflorescence development. (A–C) Gross morphology of WT (A), pUbq:OsFD2 (B) and pUbq:OsFD2 S164A (C) plants in the vegetative stage, showing no apparent difference among the three genotypes. (D–F) Gross morphology of WT (D), pUbq:OsFD2 (E) and pUbq:OsFD2 S164A (F) plants in the reproductive stage. pUbq:OsFD2 develops abnormal branch shoots with small leaves (E), whereas pUbq:OsFD2 S164A shows normal development (F). (G–I) Panicles of WT (G) and pUbq:OsFD2 (H). pUbq:OsFD2 produces more spikelets to form a dense panicle architecture (H). Scale bars are 5 cm in (A, B, C, G and H) and 10 cm in (D, E and F). (J) Flowering times of transgenic plants of the T0 generation under SD conditions. WT indicates plants regenerated from non-transformed calli. Statistical significance compared with the WT was calculated using Student’s t-test.
