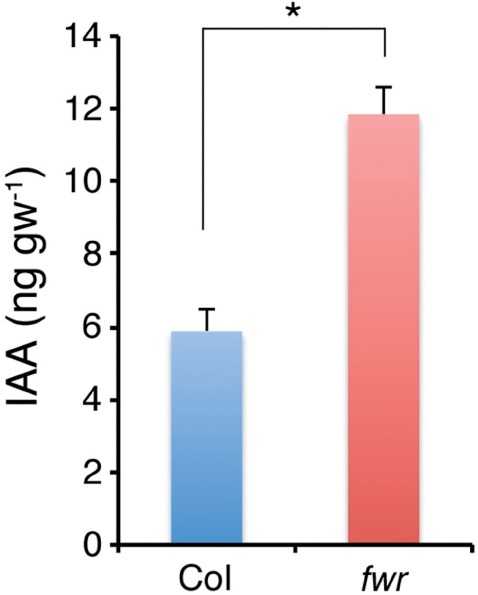
Fig. 8.

IAA levels in Col and fwr mutant seedlings. IAA levels (ng g−1 FW) in the roots of the 5-day-old Col and fwr mutant seedlings are shown (n = 3). Error bars indicate the SEM. The asterisk indicates a statistical difference (P < 0.001 by a two-sided t-test). Experiments were repeated twice, and similar results were obtained in each experiment.
