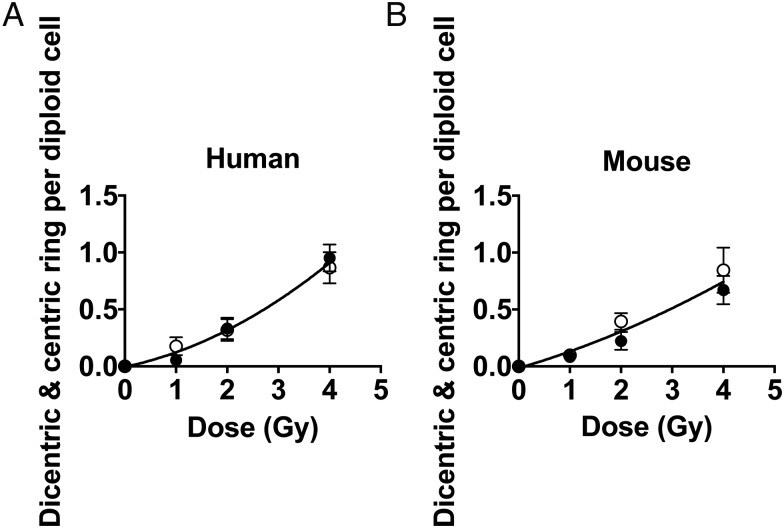
Fig. 3.
Dose–response curves obtained by two students. Each scorer used independent slides and scored a minimum of 50 metaphase cells, for a total of 100 metaphase spreads per dose. Cells were exposed to gamma rays in G0/G1-phase and the first post-irradiated metaphases were harvested and stained as described in the Methods section using a fast FISH microwave time of 3 min. Ais a dose–response curve for AG1521 early passage of normal human fibroblast cell lines. Bis a dose–response curve for B70 C57bl6 mouse fibroblast cells. A white circle represents scorer 1 and a black circle represents scorer 2. Error bars indicate standard deviation for 50 scored cells.

