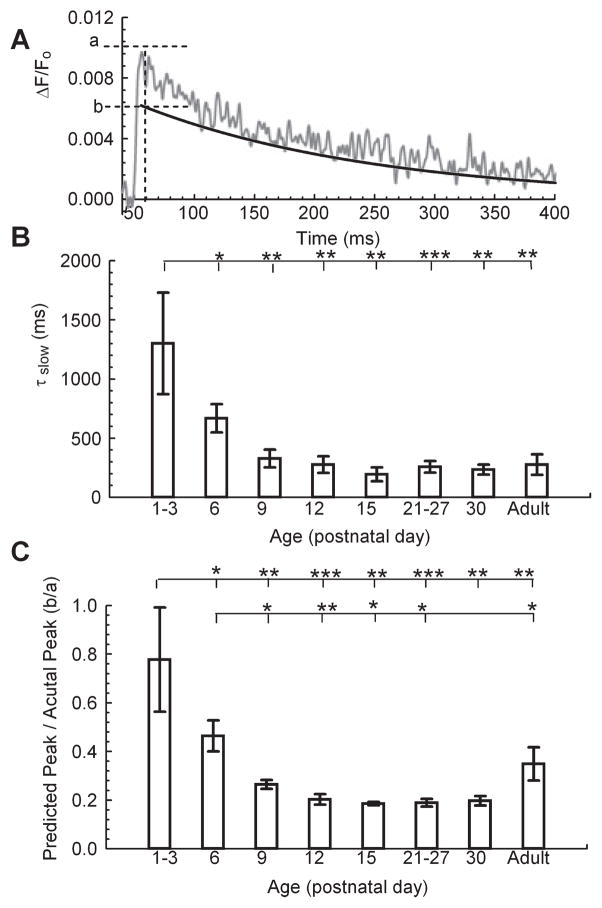
Fig 4.
Kinetic components of [Ca2+]res evaluated from fits to ΔF/F0. (A) Example ΔF/F0 trace (P9); ‘a’ is the measured peak and ‘b’ the predicted peak from extrapolated single exponential fit to ΔF/F0 data beginning 50 ms after the peak (Mg Green). (B) Slow time constant (τslow) measured by exponential fit to ΔF/F0 trace beginning 50 ms after the peak. ANOVA with Fisher’s post hoc comparison of significance of slow time constant between age groups: F40,7 = 3.03, P = 0.012. (C) Ratio of the extrapolated peak of τslow to the peak amplitude of the ΔF/F0 signal. ANOVA with Fisher’s post hoc comparison of significance of between ratio of predicted peak to actual peak between age groups: F40,7 = 3.38, P = 0.0067. P1–P3, n = 8; P6, n = 12; P9, n = 5; P12, n = 4; P15, n = 3; P21–P27, n = 9; P30, n = 3; adult, n = 4 animals; *P < 0.05, **P < 0.01 and ***P < 0.001.

