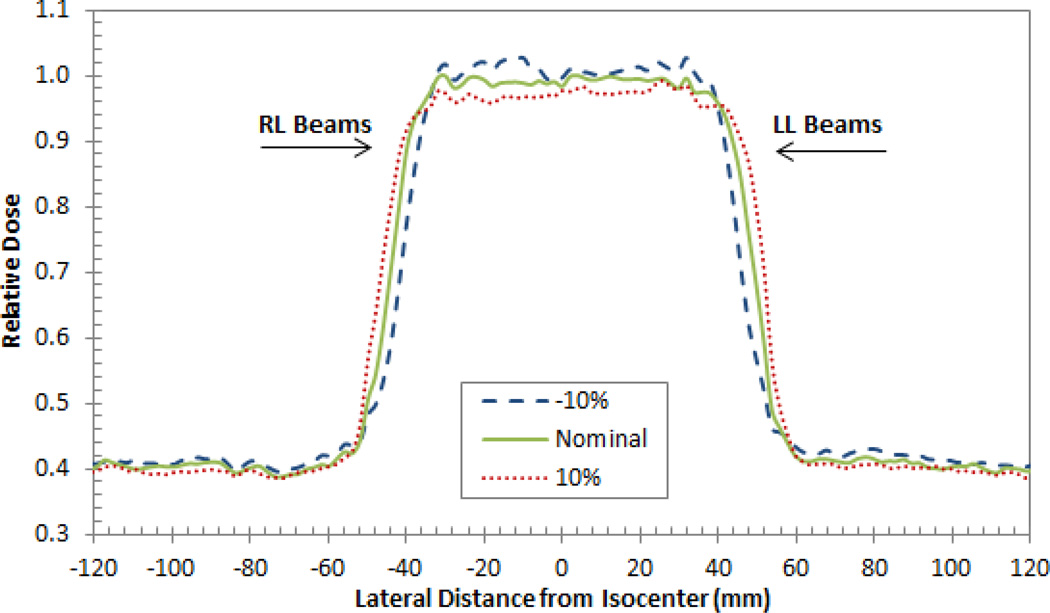
Figure 2.
A lateral depth dose curve (SOBP) composed of two right lateral (RL) beams and two left lateral (LL) beams for the prostate patient. Note the interesting shape of the dose distribution is a reflection of the sum of two opposing fields. The fluctuations along the SOBP for each case are due to the tissue heterogeneities within the patient.

