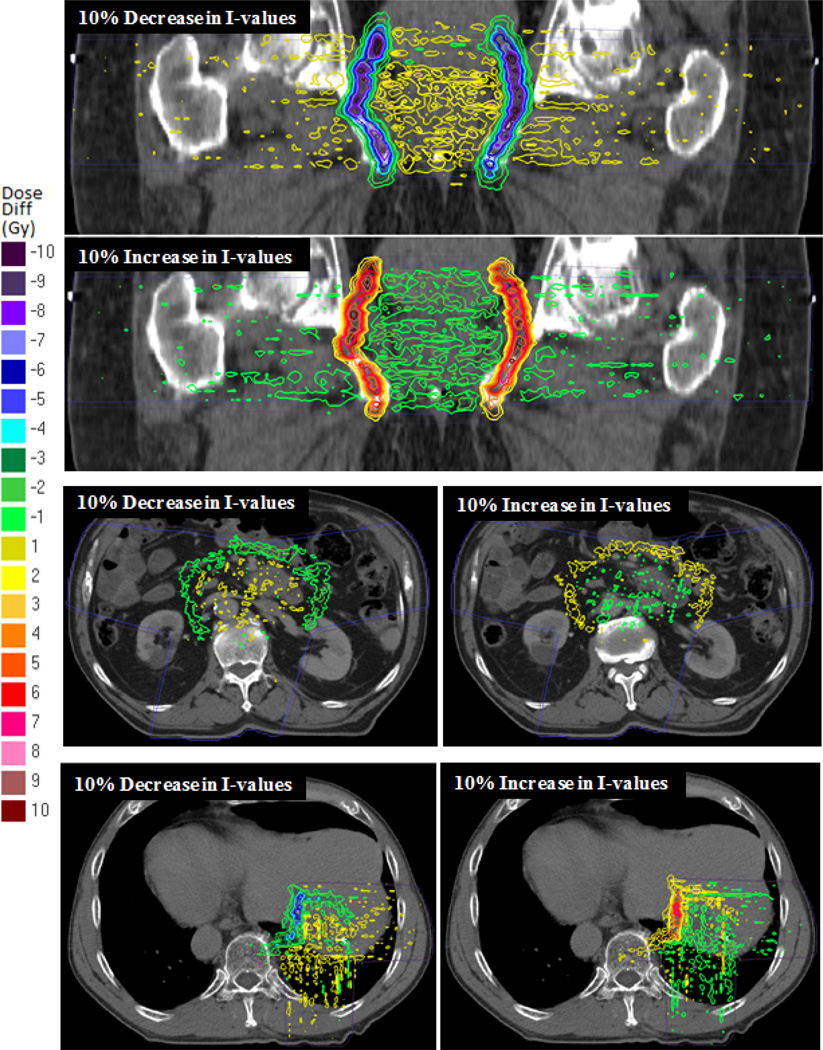
Figure 3.
Isodose curves showing the dose difference between treatments with a 10% uniform decrease/increase in tissue I-values and treatment with the nominal tissue I-values for the (top) prostate, (middle) pancreas, and (bottom) liver patients. A negative dose difference (“cool” colors) indicates a lower delivered dose than the nominal case while a positive dose difference (“warm” colors) indicates a higher delivered dose than the nominal case. The light dotted lines are nominal isodose lines to show the beam directions.

