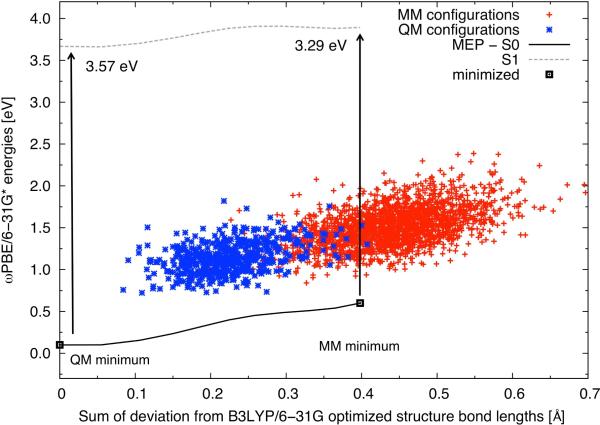
Figure 5.
The ωPBE/6-31G* minimum energy path (MEP) between the QM B3LYP/6-31G minimized S0 structure and the MM GAFF S0 minimized structure is shown in black. The TD-wPBE/6-31G* bright state for S1 along this MEP is shown in gray, with the excitation energies from minimized structures noted with the arrows. The x-axis gives the sum of the absolute value of the deviation of the bond lengths from the B3LYP/6-31G minimum. The MM GAFF and QM B3LYP/6-31G configurations are shown along this axis to give an idea of the scatter in energy and structures for the two ensembles.

