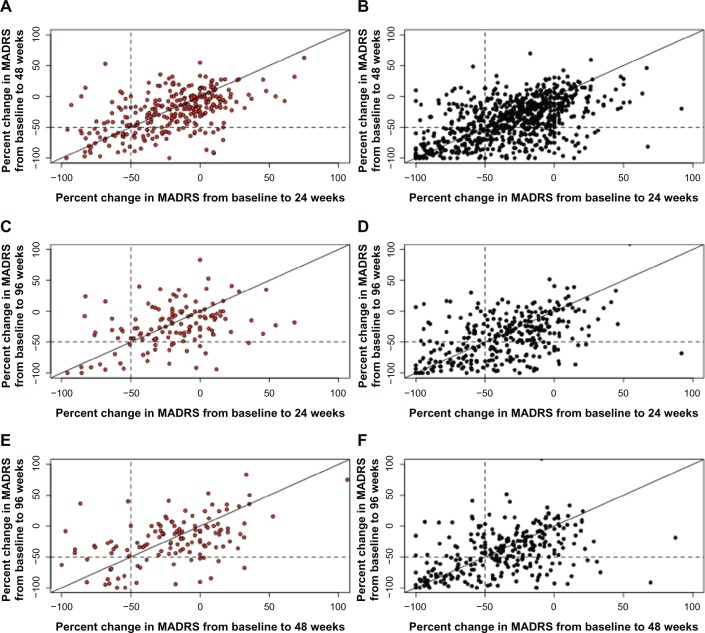
Figure 2.
Scatter plot of pairwise percent changes in MADRS from baseline over time. (A and B) Change from 24 to 48 weeks; (C and D) change from 24 to 96 weeks; (E and F) change from 48 to 96 weeks.
Note: Red, TAU; black, VNS + TAU. Patients falling into the −50 to −100 quadrant at 48 and 96 weeks are considered sustained responders.
Abbreviations: MADRS, Montgomery–Åsberg Depression Rating Scale; TAU, treatment as usual; VNS, vagus nerve stimulation.

