
Figure 2. A ~2.5 Mb deletion in Subject 2, including BDNF.
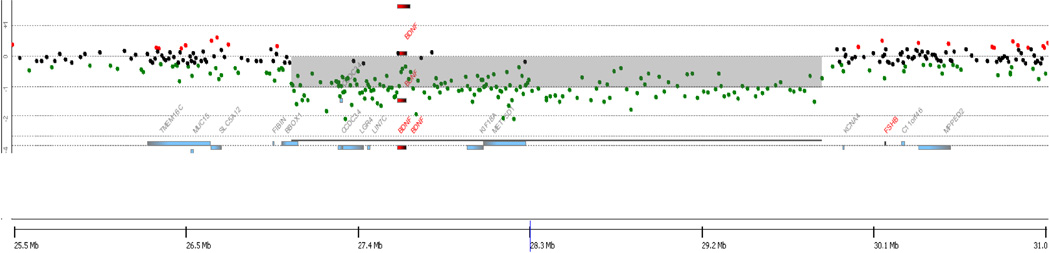
aCGH results demonstrating a deletion on chromosome 11. Gray shading represents the predicted size of the deletion, while individual probes from the array are represented by dots colored black, green, or red. Probes colored green represent decreased probe intensity from DNA from Subject 2, reflecting copy loss. hg18 build coordinates are shown on the X-axis.