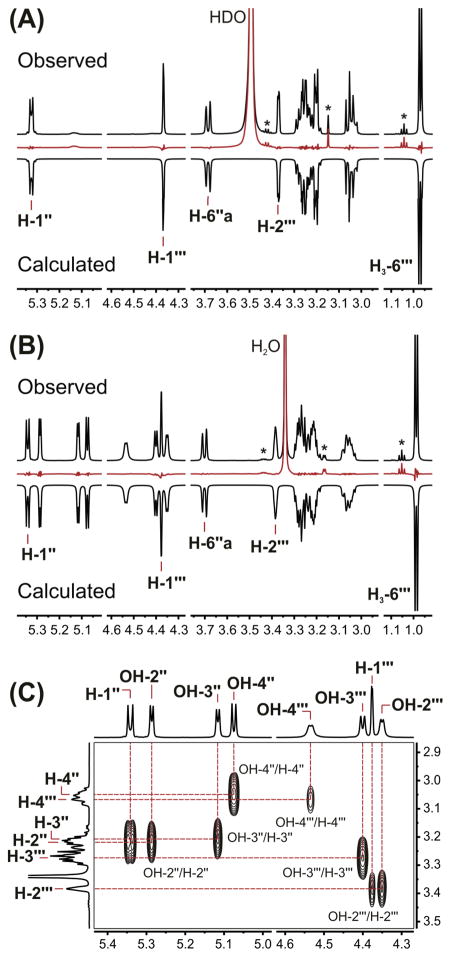
Figure 3.
The 1H iterative Full Spin Analysis of 10 (4.8 mg·ml−1, DMSO-d6): (A) Comparison of the calculated and observed 1H NMR spectra (600 MHz, 298 K) after addition of 25 μL of D2O, including residuals in red. (B) Comparison of the calculated and observed 1H NMR spectra prior to D2O exchange, including residuals in red. Asterisks (*) indicate the presence of residual ethanol in the sample. (C) Identification of individual hydroxyl proton resonances from key cross-peaks in a 2D magnitude-mode 1H,1H-COSY experiment.

