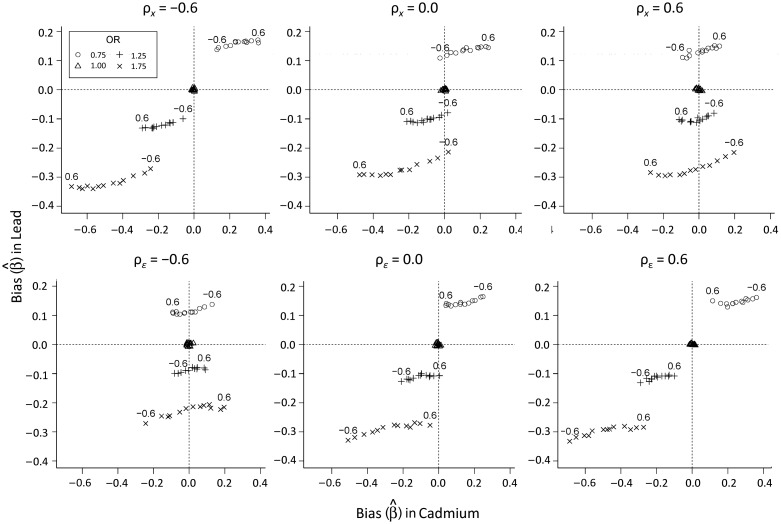
Figure 1.
Bias in the associations between cadmium and lead levels and anovulation under high levels of measurement error (R = 0.50) in main-effects models, with varying levels of true correlation between biomarkers (ρx) and error correlation (ρɛ), BioCycle Study, 2005–2007. The upper 3 panels show fixed levels of ρx and ρɛ values varying from −0.6 to 0.6, while the lower 3 panels show fixed levels of ρɛ and varying ρx values. (OR, odds ratio).

