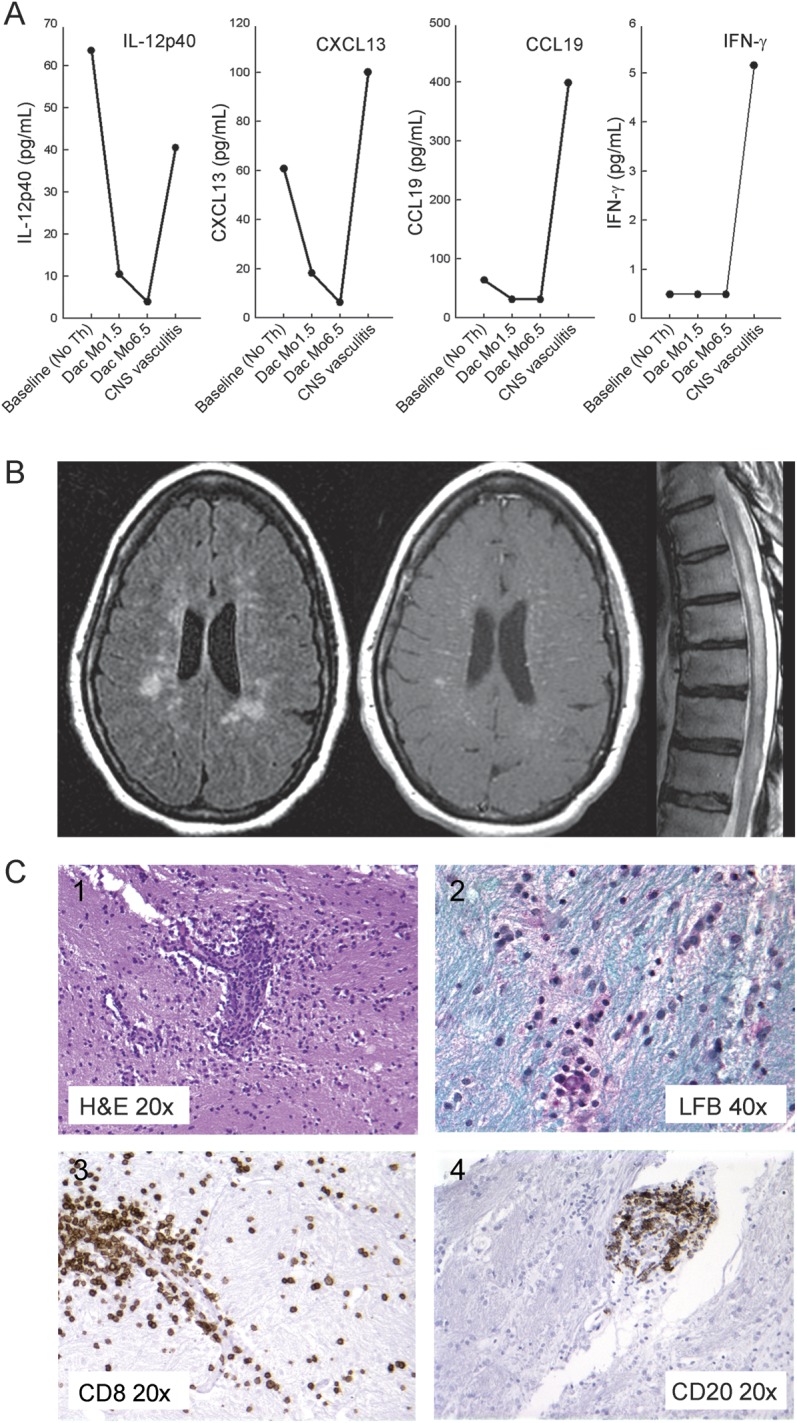
Figure 2. Intrathecal inflammatory biomarkers, MRI, and pathology at the time of CNS vasculitis.

(A) CSF analysis of soluble inflammatory biomarkers. (B) Representative MRI: fluid-attenuation inversion recovery, T1-weighted image obtained postinjection of gadopentetate dimeglumine (Magnevist 0.1 mmol/kg, Bayer Healthcare Pharmaceuticals, Wayne, NJ) of the brain, and T2-weighted image of the thoracic spinal cord. (C) Histologic analysis of brain biopsy: hematoxylin & eosin (H&E) stain (C1) demonstrated lymphocytic infiltration of small vessels with structural damage to the vessel wall; Luxol fast blue (LFB) (C2) failed to reveal clear areas of demyelination in sampled biopsy tissue. Lymphocytic infiltrate had abundance of CD8 T cells and B cells as evidenced by immunohistochemistry for CD8+T cells (C3) and CD20+ B cells (C4). IFN = interferon; IL = interleukin.
