Figure 1.
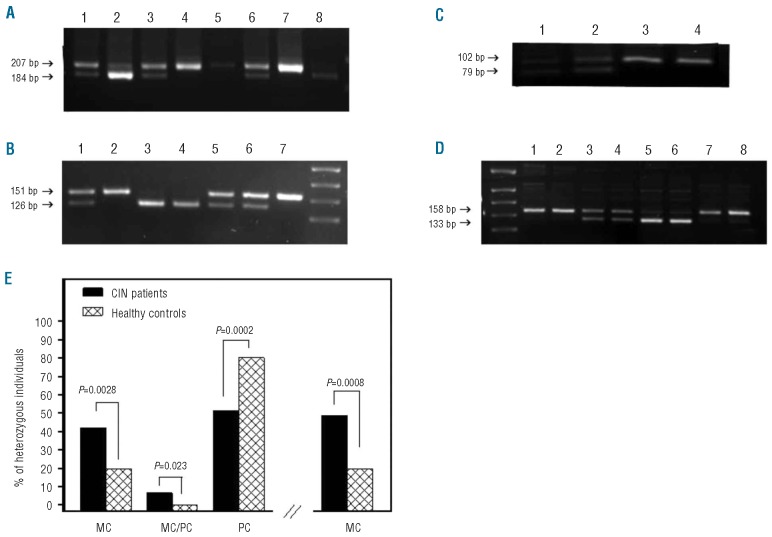
Genotyping, clonality analysis and frequency of the expression pattern of G6PD and/or IDS polymorphisms in CIN patients and healthy individuals. Genomic DNA was extracted from PB samples of CIN patients and healthy controls and genotyping for polymorphisms of G6PD and IDS genes was performed by a PCR-based restriction fragment length polymorphism assay. Total RNA was isolated from lymphocytes and granulocytes of heterozygous subjects and clonality analysis was performed by RT-PCR. (A) Genotyping of G6PD. Lanes 1, 3 and 6 show heterozygous (C/T), lanes 2 and 8 homozygous (T/T), and lanes 4, 5 and 7 homozygous (C/C) subjects. (B) Genotyping of IDS. Lanes 1, 5 and 6 show heterozygous (C/T), lanes 2 and 7 homozygous (T/T), and lanes 3 and 4 homozygous (C/C) subjects. (C) Clonality analysis of G6PD RT-PCR products in CIN patients. Lanes 1 and 2 show a polyclonal pattern in granulocytes and lymphocytes, respectively, and lanes 3 and 4 show a monoclonal pattern in granulocytes and lymphocytes, respectively. (D) Clonality analysis of IDS RT-PCR products. Lanes 1 and 2 show monoclonal patterns in granulocytes and lymphocytes, respectively (CIN); lanes 3 and 4 show polyclonal patterns in granulocytes and lymphocytes, respectively (CIN); lanes 5 and 6 show monoclonal pattern in granulocytes and lymphocytes, respectively (healthy control); lanes 7 and 8 show monoclonal pattern in granulocytes and lymphocytes, respectively (healthy control). (E) The bars on the left represent the frequency of patients and healthy individuals with a monoclonal (MC) pattern of at least one gene polymorphism in both lymphocytes and granulocytes, monoclonal pattern in granulocytes and polyclonal pattern in lymphocytes (MC/PC) and polyclonal (PC) pattern in both cell populations. The bars on the right represent the overall frequency of patients and healthy individuals displaying monoclonality in at least one cell population. Comparison between patients and controls has been performed by means of the χ2 test and P values are shown.

