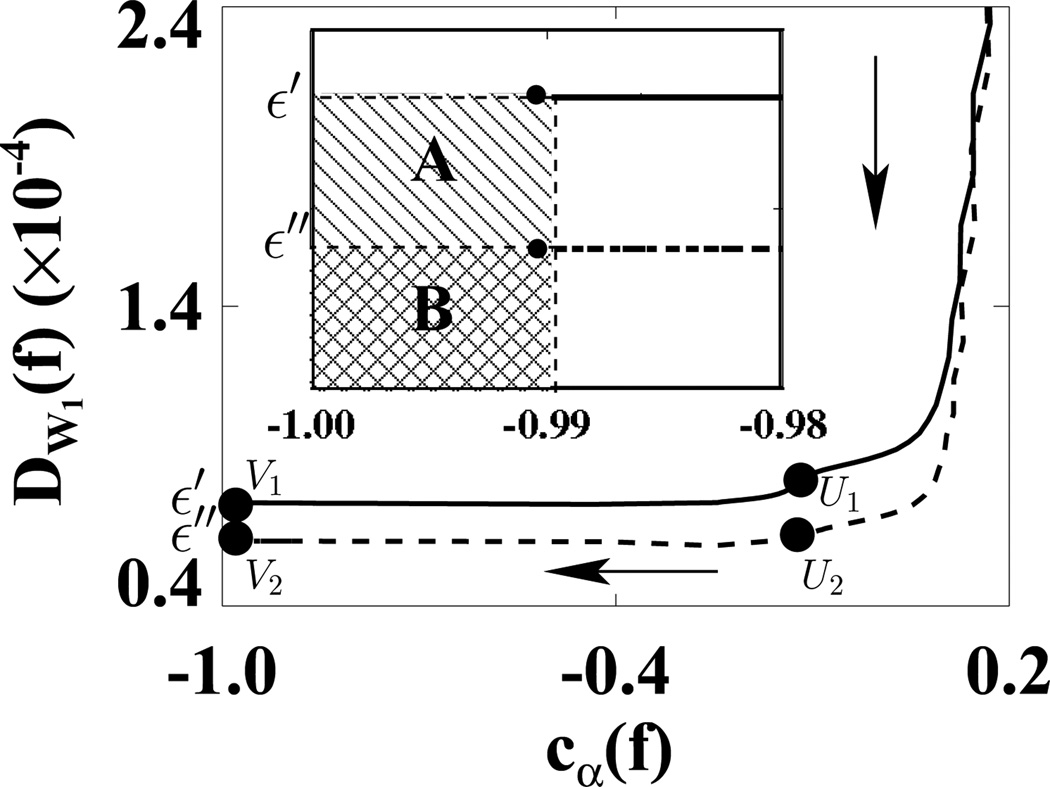
Figure 15.
Data divergences D𝒲1 as functions of cα(f) calculated for ASD-WPOCS reconstructions from 120-view (solid curve) and 180-view (dashed curve) patient data. Regions A ( ) and B (
 ) in the inserted panel show the designed solution sets determined for 120- and 180-view studies in a zoomed-in view. The arrow indicates the ascending direction for iteration numbers. The respective numbers of iterations are about 60 at points U1 and U2 and 300 at points V1 and V2.

