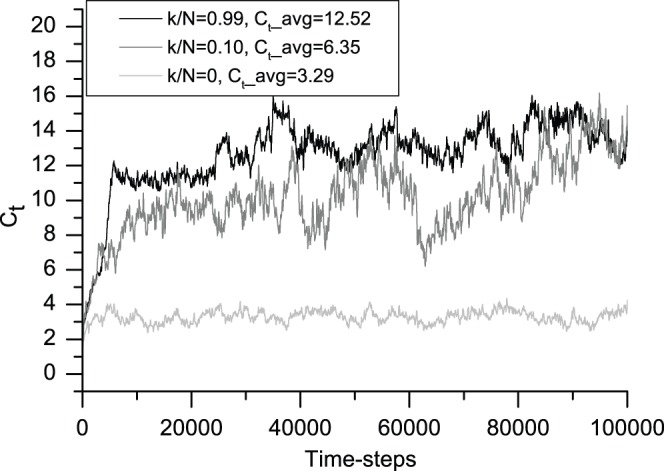
Figure 5. Evolution in the degree of clustering associated with the degree of information sharing.

This figure shows the 200-iteration moving average of the degree of clustering. From bottom to top, light gray (k/N = 0), gray (k/N = 0.10) and black (k/N = 0.99) correspond to typical cases from no information sharing to the most information sharing, respectively. The average degrees of clustering Ct_avg for the three cases are 3.29, 6.35 and 12.52, respectively. The agents in the pheromone-like mechanism show a much tighter integration than in the other two. All of the averages are calculated after the first 10,000 time-steps.
