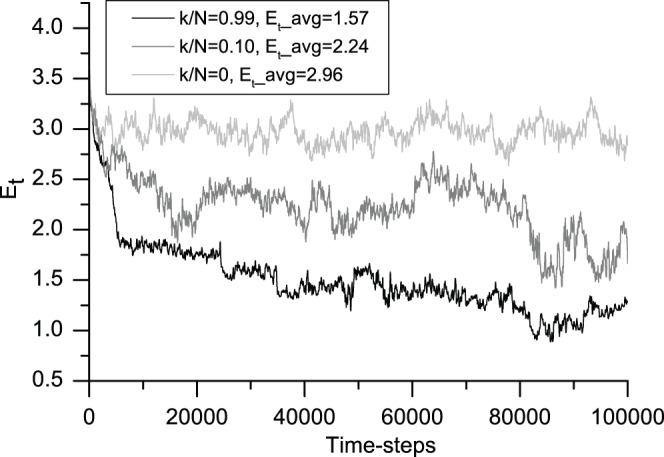
Figure 6. Evolution in simple social entropy associated with the degree of information sharing.

This figure shows the 200-iteration moving average of social entropy. From top to bottom, light gray (k/N = 0), gray (k/N = 0.10) and black (k/N = 0.99) correspond to the typical cases from no information sharing to the most information sharing, respectively. The average simple social entropy values Et_avg for the three cases are 2.96, 2.24 and 1.57, respectively. This figure shows that in this model, no information sharing results in the least ordered system with the highest entropy, whereas the pheromone-like information sharing results in the most ordered system with the lowest entropy. All of the averages are calculated after the first 10,000 time-steps.
