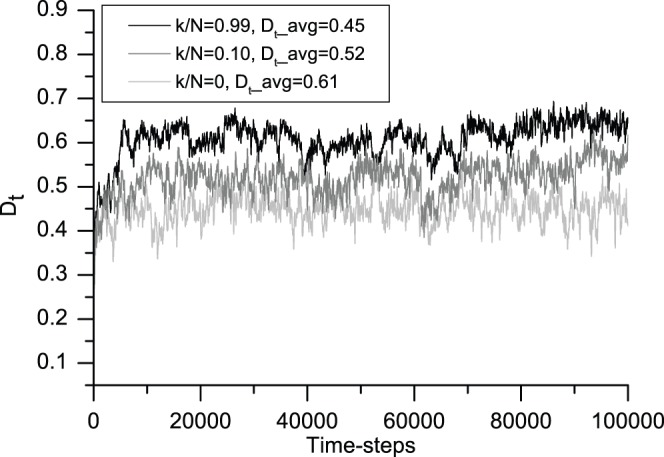
Figure 7. Evolution in the successful trade ratio associated with the degree of information sharing.

This figure shows the 200-iteration moving average of the successful trade ratio. From bottom to top, light gray (k/N = 0), gray (k/N = 0.10) and black (k/N = 0.99) correspond to typical cases from no information sharing to the greatest degree of information sharing, respectively. The average successful trade ratios Dt_avg associated with the three cases are 0.45, 0.52 and 0.61, respectively. In this model, more information promotes more successful trades. All of the averages are calculated after the first 10,000 time-steps.
