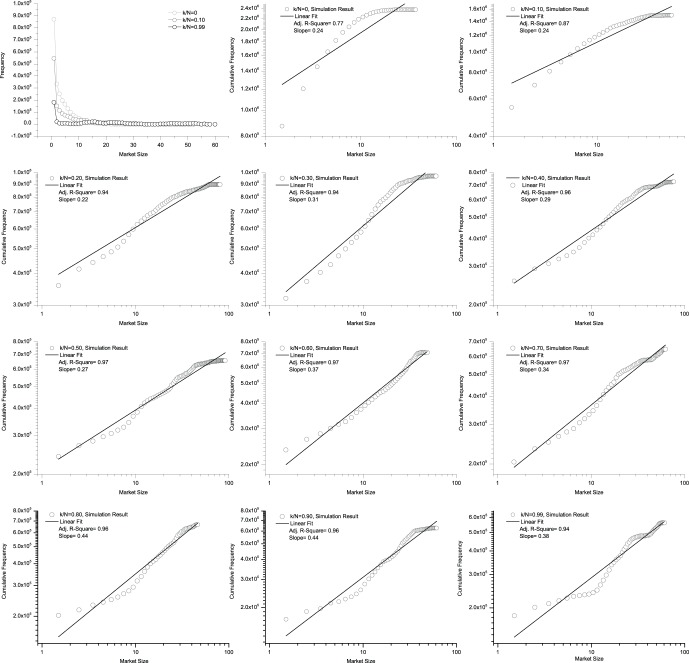
Figure 8. Market size distributions when the extent of information sharing varies from less to more.
The three curves in the top left panel represent typical cases for information sharing, k/N = 0, 0.10, 0.99. To keep the curves clearly visible, we do not show all of the cases with k/N ranging from 0 to 0.99 in this panel. The rest of the panels in Figure 8 contain log-log plots of the cumulative distribution and a linear fit for all the cases k/N = 0, 0.10, 0.20, …, 0.90, 0.99. The market size frequency is calculated for 100,000 time-steps after the first 10,000 time steps. For k/N = 0, 0.10, the linear fits have an Adjusted R-Square less than 0.90, which means that there is not strong evidence of a power-law distribution. For k/N≥0.20, however, all of the linear fits have an Adjusted R-Square greater than 0.90, which means that there is strong evidence of a power-law distribution.

