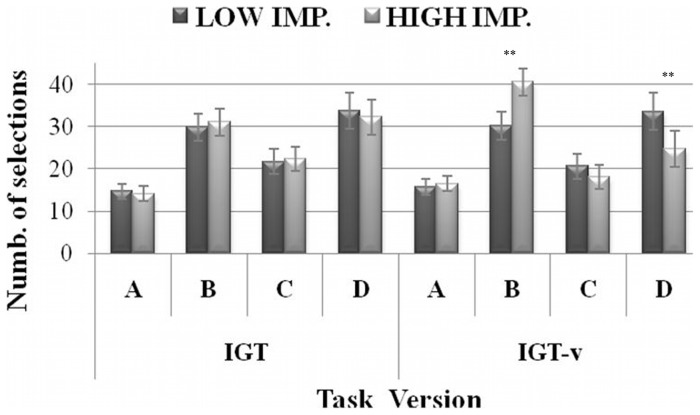
Figure 4. Selection from each deck as a function of IGT version for Impulsivity levels.
Mean number of cards chosen from each deck, in the original (IGT, on the left) and modified (IGT-v, on the right) task versions for participants with Low vs. High. Impulsivity levels. Vertical bars denote +/−0.95 confidence intervals, **p≤0.01.

