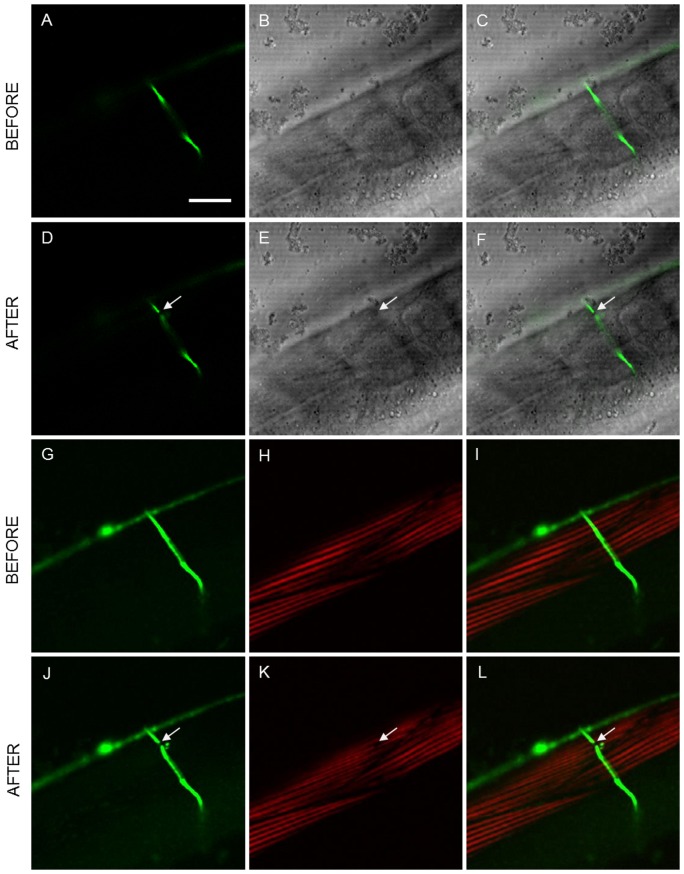
Figure 3. Collateral damage assessment using linear and nonlinear imaging techniques.
Linear: a) confocal, b) LT and c) combined images of the region surrounding the axon before the laser dissection; d–f) show the same region after the surgery (Media S2). Nonlinear: g) TPEF, h) SHG and i) combined images before the laser dissection; j–l) show the same region after the surgery. No collateral damage was observed in CFM while damage in muscle is evidenced with SHG microscopy. Arrows point to the place of the laser axotomy. Scale bar 20 µm.

