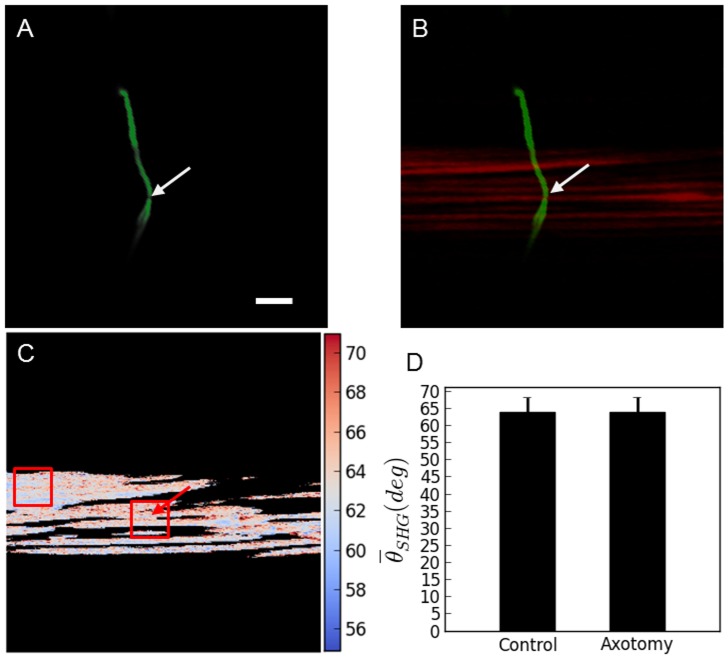
Figure 5. PSHG microscopy for the damage assessment after the axotomy.
a) TPEF reveals a successfully cut axon. b) SHG signal from body wall muscle do not change after the surgery; c) Post-surgical pixel-resolution mapping of myosin θSHG at the muscle obtained from PSHG (color bar in degrees); d) θSHG (mean±1 standard deviation) for the muscles in the region surrounding the cut and in the control region (white squares). The control region was selected in the intact adjacent muscular cell far away from the axotomy. Unpaired two tailed t- test (n = 200 pixels for both sets) yields p>0.05 meaning that θSHG mean is not significantly different between the two regions. Arrows point to the place of the laser axotomy. Scale bar 10 µm.

