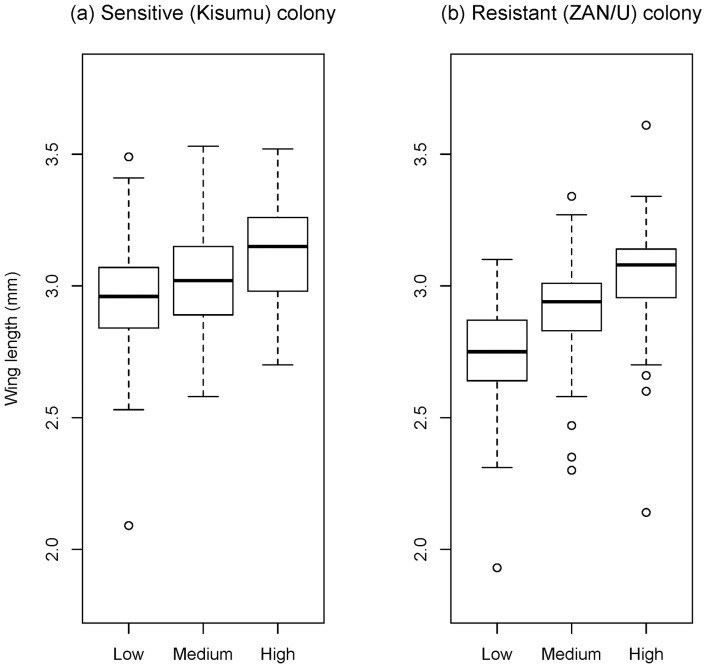
Figure 2. Boxplot of wing length by colony and diet.
A positive correlation between diet and wing length is observed in both: a) Kisumu and b) ZAN/U colonies. Thick horizontal lines represent median, bottom and upper edges of the boxes first and third quartiles, whiskers demonstrate minimum and maximum values.

