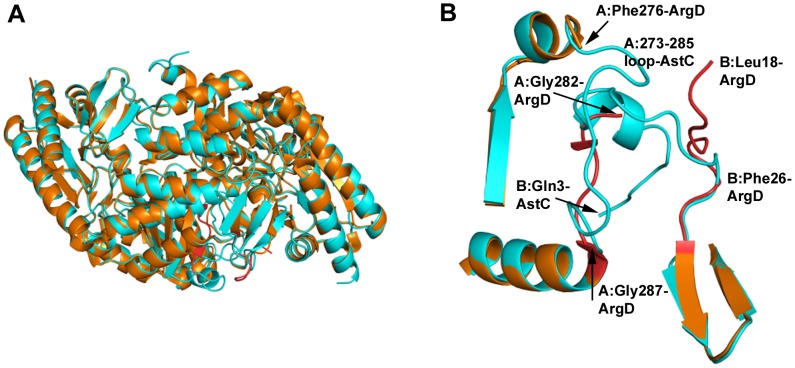
Figure 7. Comparison of AstC structure with ArgD from S. typhimurium.
Figure 7A shows the structure of 2PB0 (in burnt orange) with a dimer of AstC overlayed (cyan). The structures are very similar with the major differences being in the N-terminus (highlighted in 7B) and the loop of 277–286. Figure 7B again has the 2PB0 structure in orange and AstC in cyan, but the differences in 2PB0 are highlighted in red. On the top right hand side we have the start of the 2PB0 B chain, Leu18, which does not come into alignment with AstC until residue Phe26. At the top we have the two structures aligned at residue Phe276 where the density falls off for 2PB0 and there is a gap to residue Gly282 (hidden in the helix of the N-terminus of AstC). The 2PB0 model for this part of the chain comes back into alignment with AstC just before the helix at residue Gly287 (bottom of figure).

