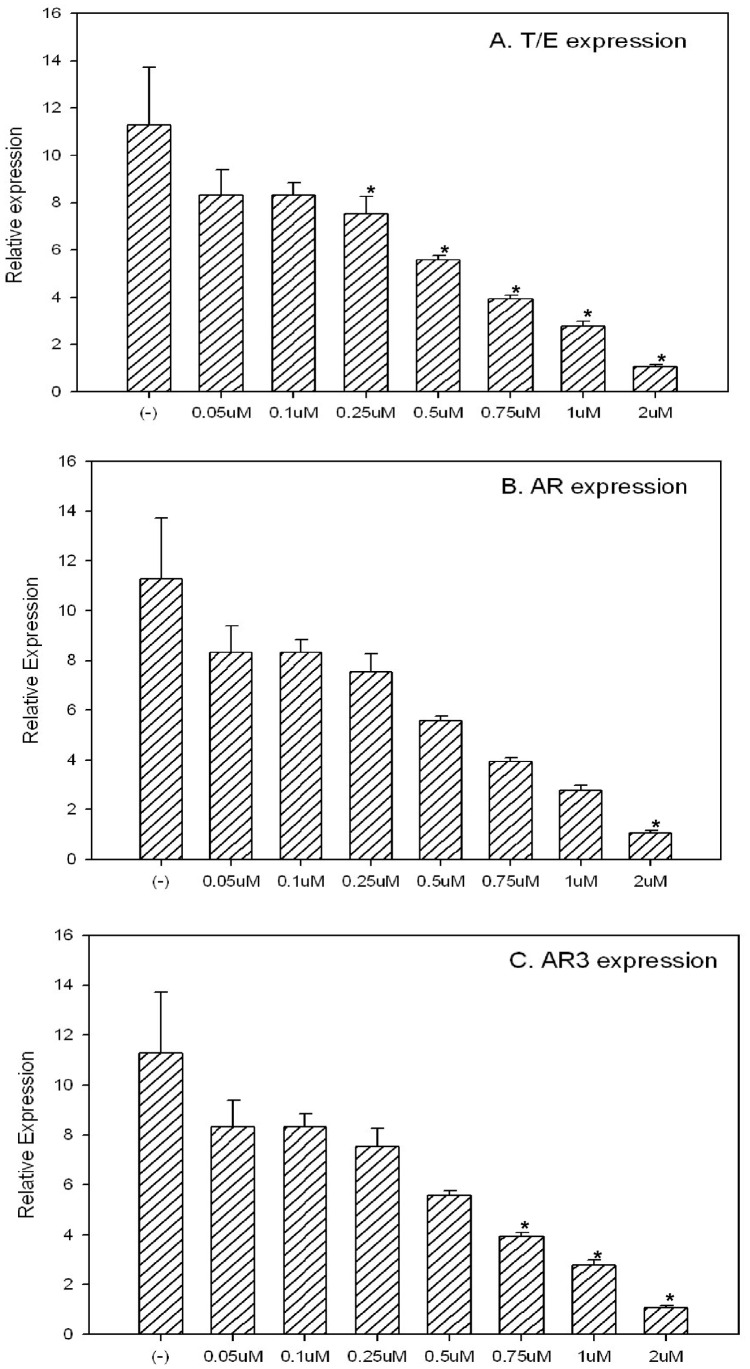
Figure 3. Celastrol targets T/E fusion, AR and AR3 expression at transcriptional level by quantitative Real-time PCR.
When VCaP cells were treated with different concentration of Celastrol for 24 h, inhibition of targeted genes were evaluated by quantitative real-time PCR. β-actin was used as the control gene. T/E fusion expression(A), AR(B) and AR3 (C) expression are shown in each figure. The inhibition of these genes at RNA levels by Celastrol are significant in a dose-depedent manner. Asterisks indicate statistically significant differences between Celastrol treated group and the control by t-test.

