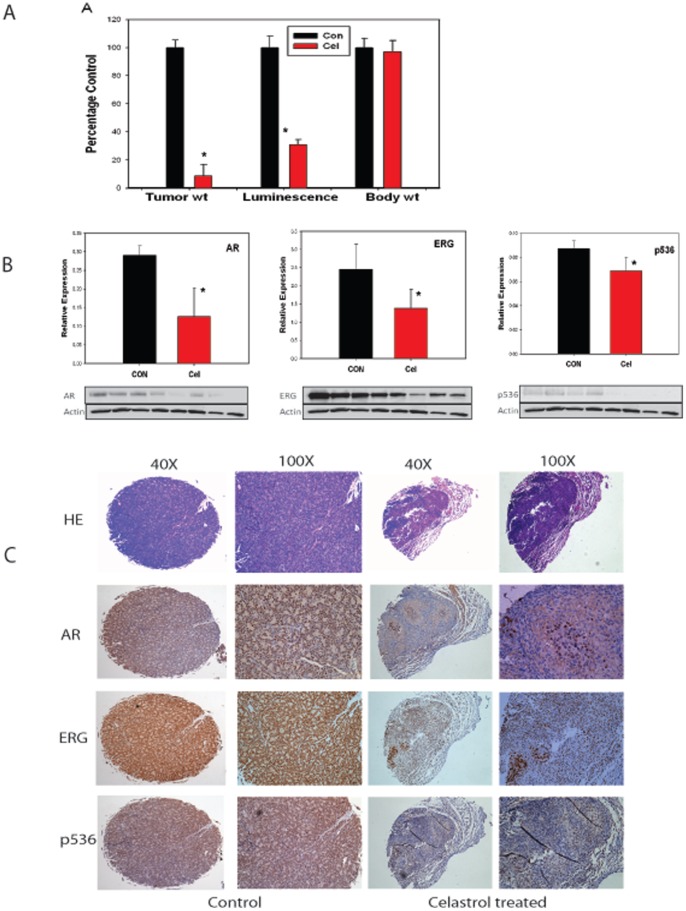
Figure 6. Celastrol inhibit VCaP cell growth in vivo.
(A) Nude mice were injected subcutaneously with VCaP cells expressing luciferase. After one week mice were treated with 0.5 mg/kg Celastrol or vehicle only. Luciferase flux of tumors prior to euthanasia and tumor and body weights at termination of treatment are shown. Asterisks indicate statistically significant differences between treated group and control group. (B) Inhibition of AR, ERG and p536 by quantitative Western blot normalized to β-actin. Representative Western blot of VCaP tumor extracts with antibodies against AR, ERG or p536 is shown. In each western blot, lanes 1–4 are the control tumors and lanes 5–8 are Celastrol treated tumors. β-actin is a loading control. (C) A tissue microarray (TMA) was prepared for IHC analysis for these mice tumors collected. Representative samples are shown. Images in the left two panels are for a control mouse tumor and images in the right two panels are for a Celastrol treated mouse tumor. H&E, AR, ERG and p536 staining are shown both at magnification of 40× and 100×. Dramatically decreased AR, ERG and p536 expression caused by Celastrol treatment are seen.

