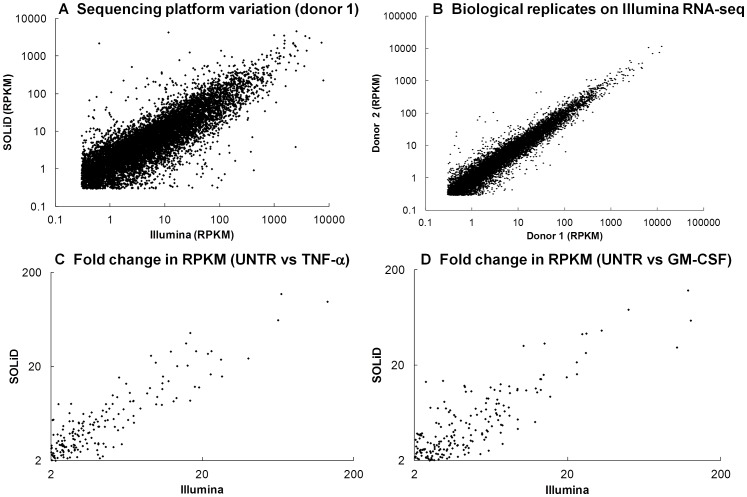
Figure 2. Comparison of sequencing platform variation and biological variation.
(A) RPKM values (≥0.3) for untreated neutrophils from the same donor sequenced on the SOLiD v4.0 and Illumina HiSeq 2000 platforms (Rs = 0.784, Pearson Correlation). (B) RPKM values (≥0.3) for untreated neutrophils from two different biological donors sequenced on the Illumina HiSeq 2000 platform (Rs = 0.947, Pearson Correlation). (C,D) Correlation between the fold change in RPKM value for genes up-regulated by (C) TNF-α (Rs = 0.885) and (D) GM-CSF (Rs = 0.831) measured in neutrophils from the same donor on the SOLiD v4.0 and Illumina HiSeq 2000 platforms.

