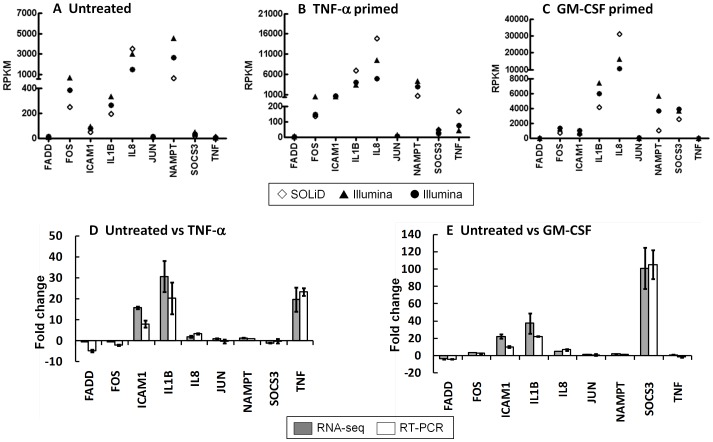
Figure 3. Validation of expression values of a selection of genes measured by RNA-seq and real-time PCR.
(A–C) Expression levels of a selection of genes with a range of RPKM values across the two NGS platforms (⋄ SOLiD, n = 1, •▴ Illumina, n = 2) in (A) untreated, (B) TNF-α-treated and (C) GM-CSF-treated neutrophils. Symbols overlap at some datapoints due to highly similar RPKM values. (D,E) Fold change in expression of genes in (D) TNF-α and (E) GM-CSF-treated neutrophils compared to unstimulated, measured by real-time PCR (grey bar, n = 3) and RNA-seq (open bar, n = 3).

