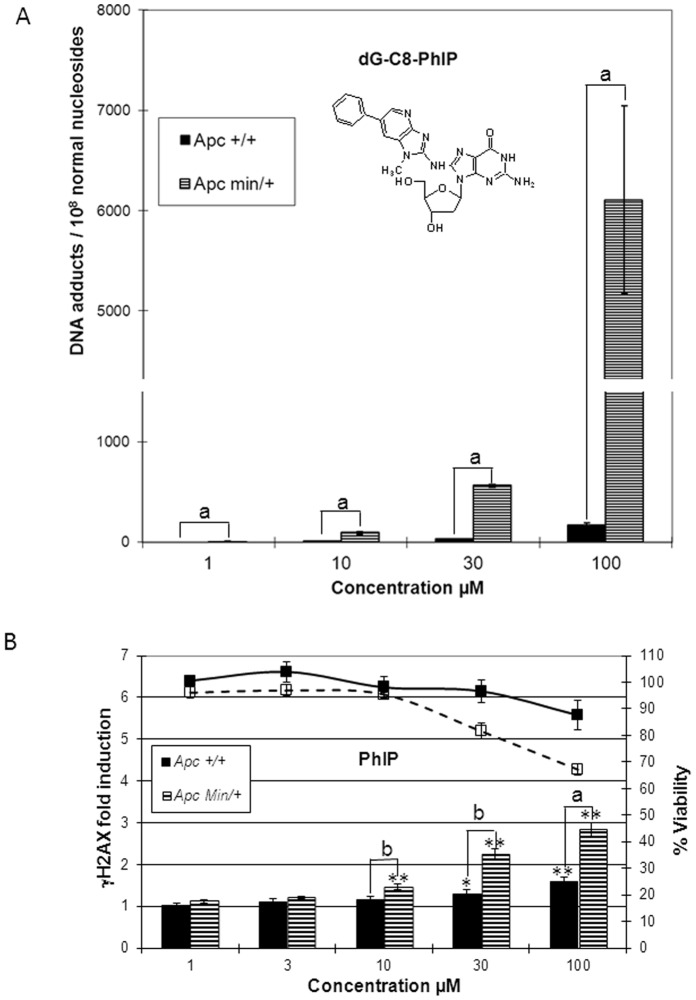
Figure 3. Genotoxicity of PhIP in Apc+/+ and ApcMin/+ cell lines.
Apc+/+ and ApcMin/+ cells were treated with the indicated concentrations of PhIP for 24 h. (A) Genotoxicity was evaluated by HPLC-MS/MS quantification of dG-C8-PhIP in DNA. (B) Genotoxicity was evaluated with γHAX ICW assay. Bars represent the average of at least three independent experiments with SEM. Statistically significant increase in H2AX phosphorylation compared with DMSO control using Student’s test; *, p<0.05; **, p<0.01. Statistically significant difference between Apc+/+ and ApcMin/+ cells using Student’s test; b, p<0.05; a, p<0.01.

