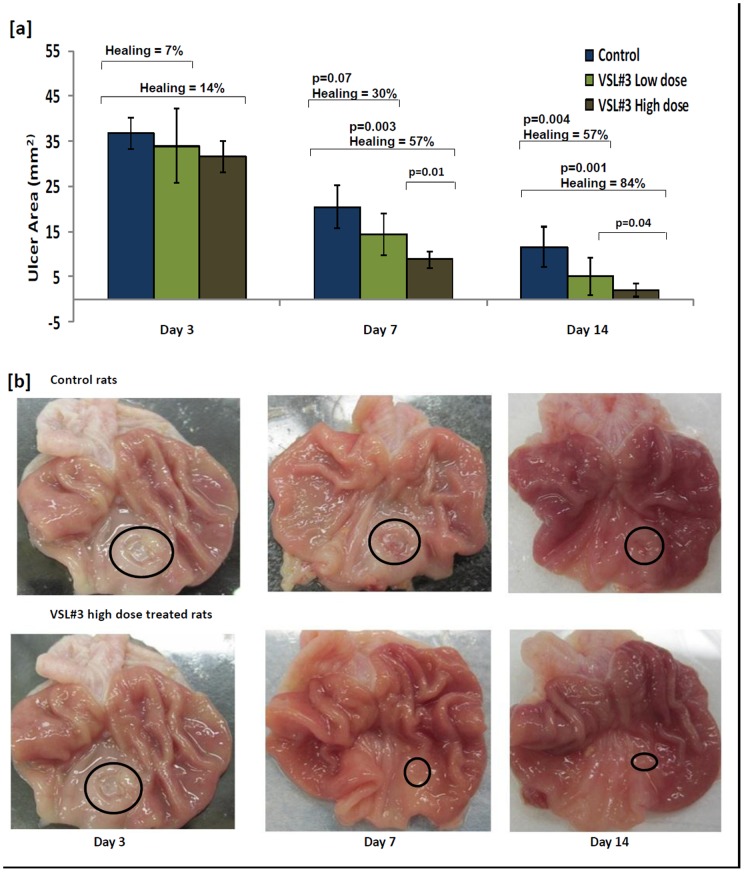
Figure 1. Effect of VSL#3 treatment on acetic acid induced gastric ulcer healing in rats.
[a] The ulcer area (mm2) plotted for animals with acetic acid induced gastric ulcer on day 3, 7 and 14 of treatment with vehicle (Blue), VSL#3 low (light green) and high (dark green) dose. Data is represented as means ± SEM from 6 animals per day. Percent ulcer healing calculated for animals treated with VSL#3 low (light green) and high (dark green) dose in comparison to the control animals as well as the significant p values are represented in the upper section of the plot. [b] Morphological view of acetic acid induced gastric ulcer on day 3, 7 and 14 of treatment with vehicle (Top), VSL#3 high dose (Bottom).

