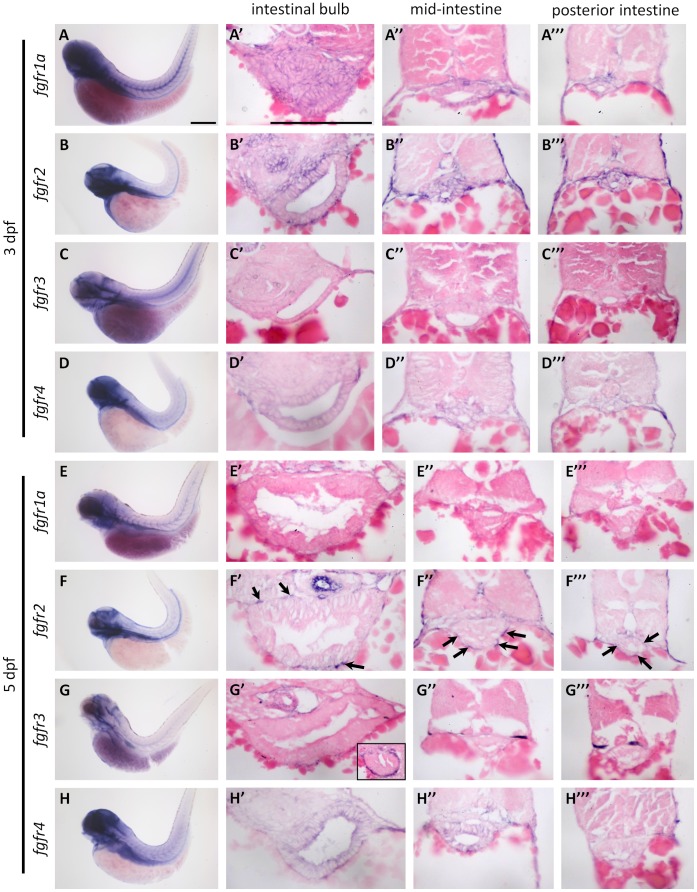
Figure 2. The expression pattern of zebrafish fgfr genes.
The expression of fgfr1a-4 was analyzed by WISH: (A–D) at 3 dpf and (E–H) at 5 dpf. WISH embryos were sectioned and analyzed for expression of fgfr1a-4 in: (A’–H’) the intestinal bulb, (A’’–H’’) the mid-intestine, and (A’’’–H’’’) the posterior intestine. Black arrows indicated the fgfr2 expression in mesenchymal cells. Scale bars = 200 µm.

