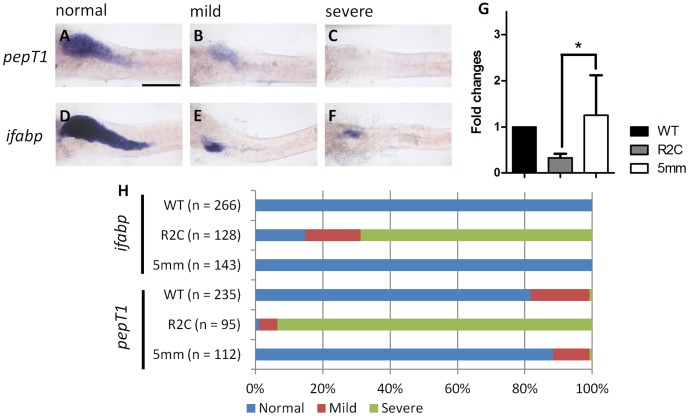
Figure 5. Absorptive cell differentiation in fgfr2c morphants.
The pepT1 and ifabp WISH were used to analyze enterocyte differentiation in 5 dpf embryos. Three different signal levels were classified as (A,D) normal, (B,E) mild, and (C,F) severe. (G) qPCR analysis of the pepT1 expression level in the fgfr2c morphants and control embryos. Data were normalized with β-actin1 and expressed as fold-induction relative to wild type embryos. Error bars indicate SD. *indicates P<0.05. (H) The bar charts show the percentages of three expression levels of these two genes in WT embryos, and fgfr2c and fgfr2c-5 mm morphants. Scale bar = 200 µm.

