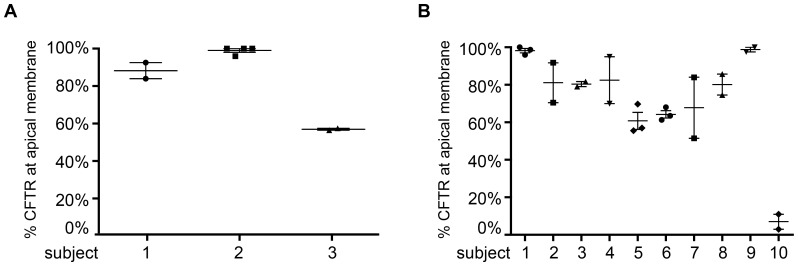
Figure 2. Analysis of apical CFTR expression in nasal columnar epithelial cells.
The percentage of cells expressing CFTR at the apical membrane was analyzed within the E- cadherin and Ezrin positive cell compartment. Per sample on average 20 cells were counted. A. Technical variability. For three subjects, staining was performed in duplicate or quadruplicate. Proportion of columnar epithelial cells expressing apical CFTR was compared between the duplicates. Number one represents a subject with CF. B. Biological variation. 10 individuals were brushed several times and apical CFTR expression in columnar epithelial cells was compared between the different time points for each individual. Number ten represents a subject with CF.

