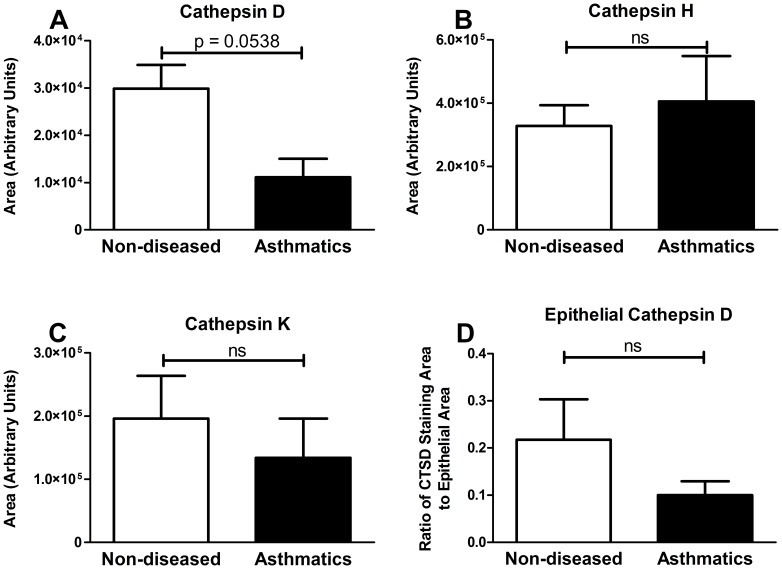
Figure 4. Cathepsin D, H and K expression in non-diseased and asthmatic tissue.
Area of cathepsin D (A, ND = 15 and A = 5), cathepsin H (B, ND = 13 and A = 5), cathepsin K (C, ND = 15 and A = 6) and epithelial specific cathepsin D (D, ND = 12 and A = 5) immunostaining in non-diseased and asthmatic sections were quantified using computerized image analysis. Data are expressed as mean ± standard error of the mean. Statistical analysis used was student’s t-test. Abbreviations A = Asthmatic, ND = Non-Diseased and ns = no significance.

