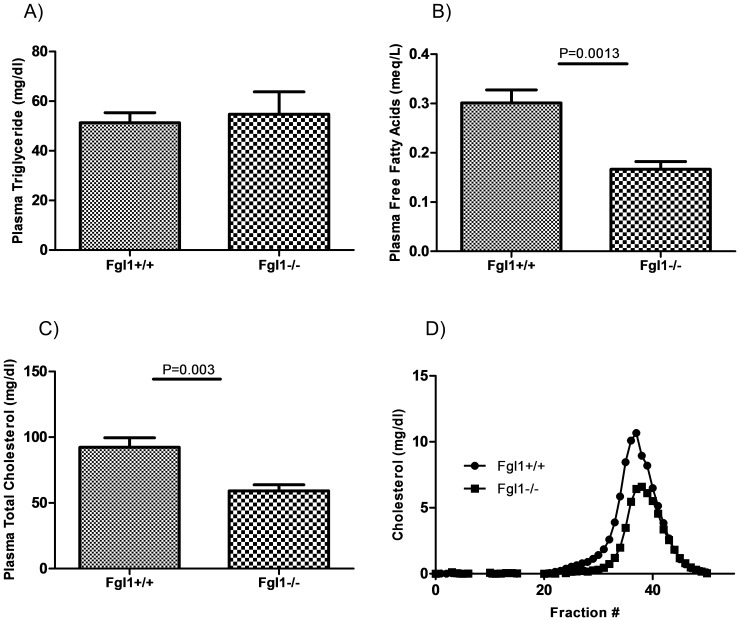
Figure 3. Plasma lipid, cholesterol and free fatty acid levels in the Fgl1 null mouse.
A) There is no significant difference in steady state plasma TG levels of Fgl1+/+ and Fgl1−/− mice. B) Free fatty acid levels are decreased in the Fgl1 null mouse (P = 0.001). C and D) Plasma cholesterol levels are levels are lower as determined by total cholesterol (P = 0.003) and FPLC analysis. n = 5 per group.

