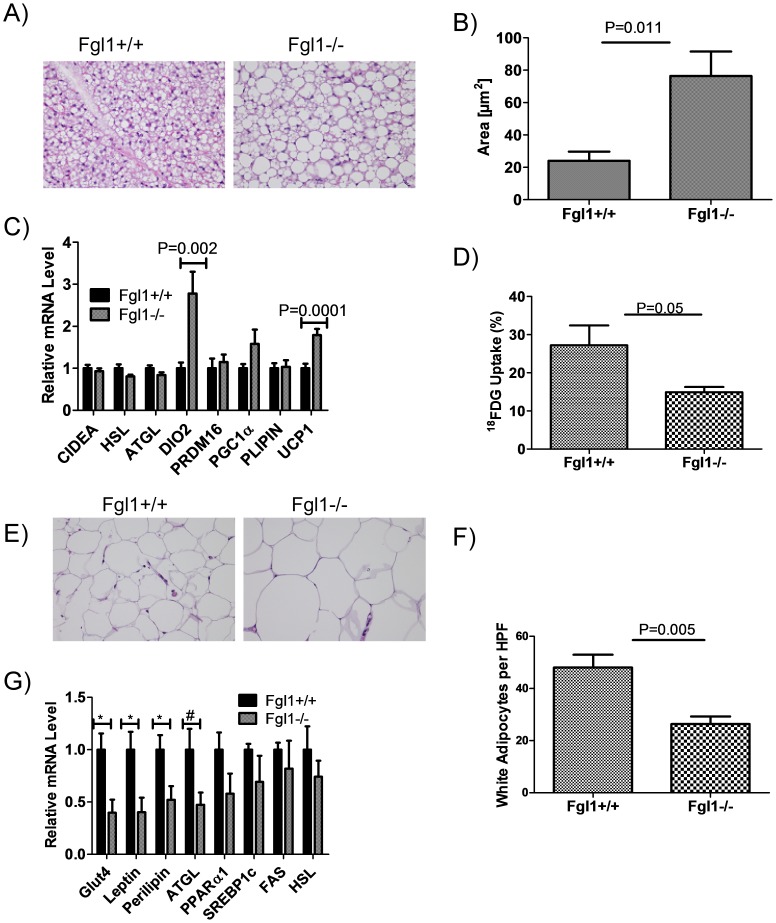
Figure 5. Structure, content and activity of adipose tissues in the Fgl1 null mouse.
A) Representative H&E stains (40× magnification) of brown adipose tissue. Lipid droplets are larger in Fgl1−/− mice. B) Quantitation of lipid droplet size show significant difference between Fgl1+/+ and Fgl1−/− mice (P = 0.011, n = 5 per group). C) Expression of brown adipose genes. Note the paradoxical up regulation of DiO2 and UCP1 (P = 0.002 and 0.0001 respectively. n = 11 per group except for Perilipin and HSL where n = 5 and 6 respectively). D) 18FDG incorporation into BAT. The % uptake represents the uptake of injected dose per gram of tissue. Note the marked decrease in radioisotope uptake in BAT (P = 0.05, n = 5 per group). E). Representative H&E stains (40× magnification) of white adipose tissue. Lipid droplets are larger in Fgl1−/− mice. F) Quantitation of number of cells per HPF shows smaller number of white adipose cells in Fgl1−/− (P = 0.005, n = 5). G) Expression of white adipose genes. Glut4, leptin and perilipin are significantly down regulated (*) with a P<0.04 for each. P for ATGL (#) is 0.06. n = 4–6 mice per group.

