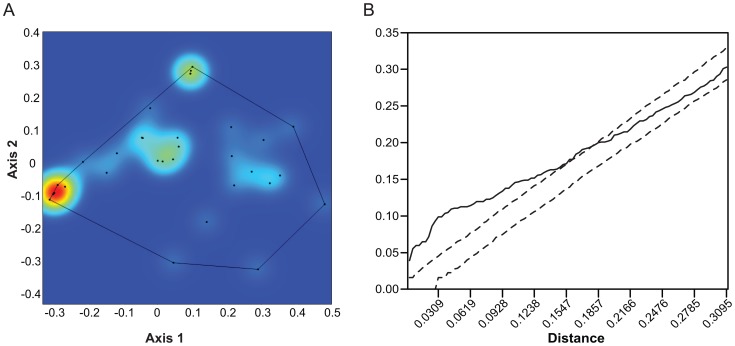
Figure 3. Point pattern analysis of the morphospace occupation pattern of extant African Carnivora.
A. Kernel density plot. The same three hotspots as in Figure 2A are seen. B. Ripley's K analysis of the patterns seen in Figure 3A. In this case, there is significant attraction between points at shorter distances (the line lies above the 95% confidence interval limits) but randomness at longer ones (the line lies within the 95% confidence envelope).

