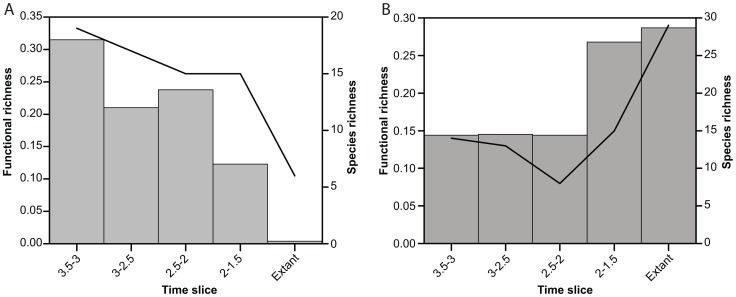
Figure 6. Functional richness and evenness through time.
A. Diagram showing changes in functional richness (histogram; left Y scale) and species richness (line; right Y scale) in eastern African large carnivorans through time. B. Same as A, but for small carnivorans. The great difference between A and B is particularly important, see text.

