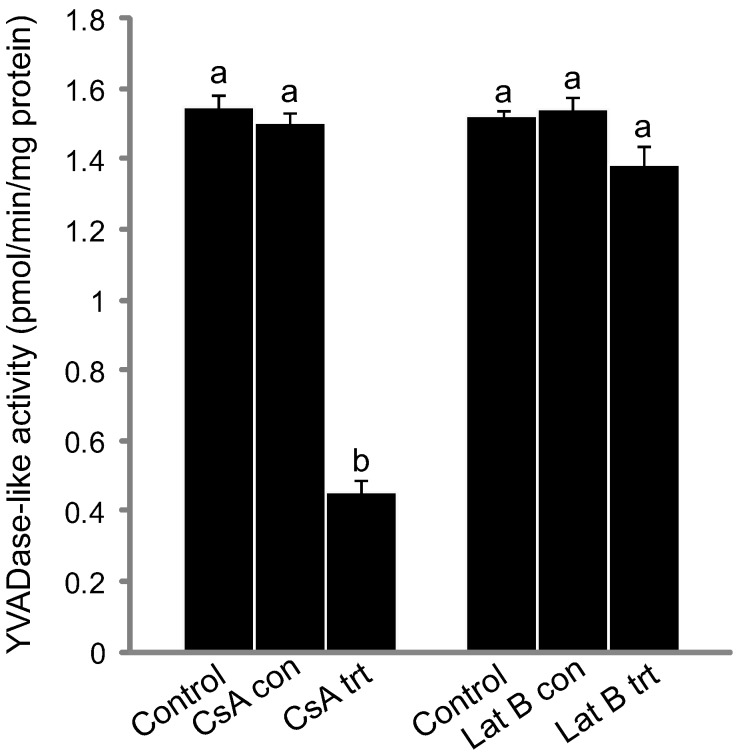
Figure 5. Kinetics of YVADase activity for cyclosporine A (CsA) and Latrunculin B (Lat B) treated leaves.
CsA and Lat B pre-perforation stage leaf data as compared to their respective experimental and non-treated controls. Data are expressed as mean ± S.E.M. (n = 3). Data represented by different letters are significantly different (P≤0.05 ANOVA).

